present
新規登録で初回購入時に$50オフ
Trading product for Range Pressure Map インジケーター EMA Volume, image 1
Range Pressure Map
インジケーター
バージョン 1.0、Sep 2026
Windows、Mac
5.0
レビュー: 2
Trading product for Range Pressure Map インジケーター EMA Volume, image 2
Trading product for Range Pressure Map インジケーター EMA Volume, image 3
Trading product for Range Pressure Map インジケーター EMA Volume, image 4
Trading product for Range Pressure Map インジケーター EMA Volume, image 5
登録日 16/09/2026

説明

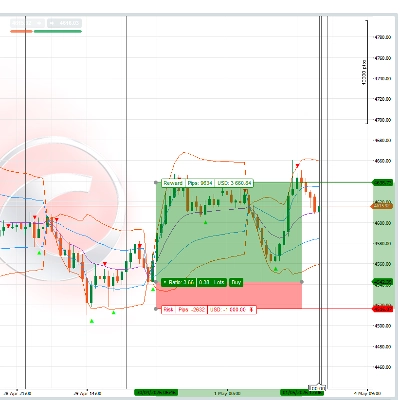
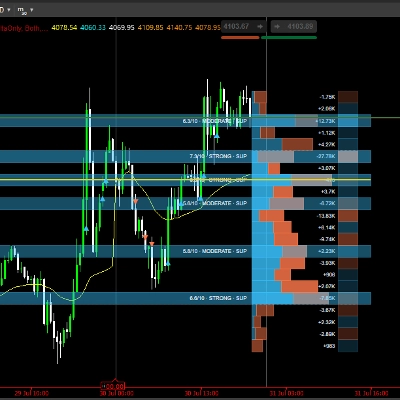
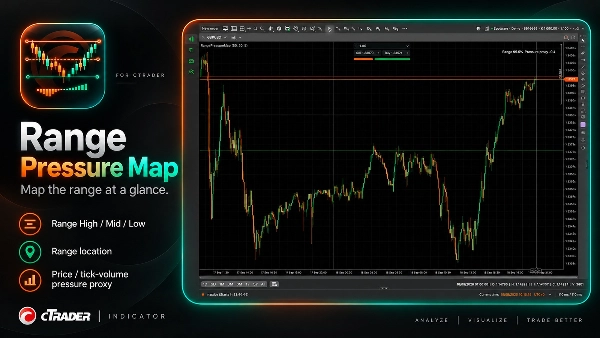
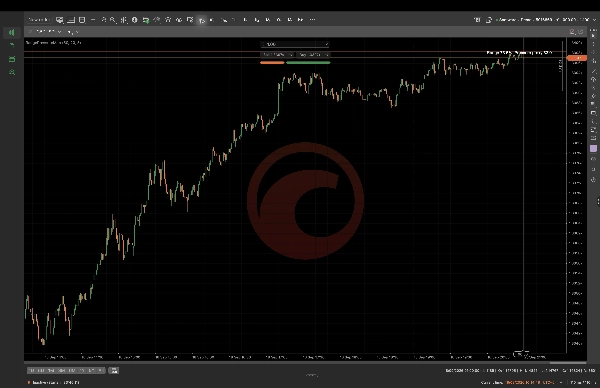
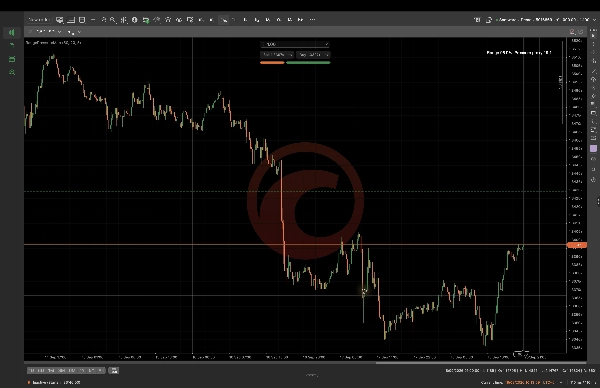
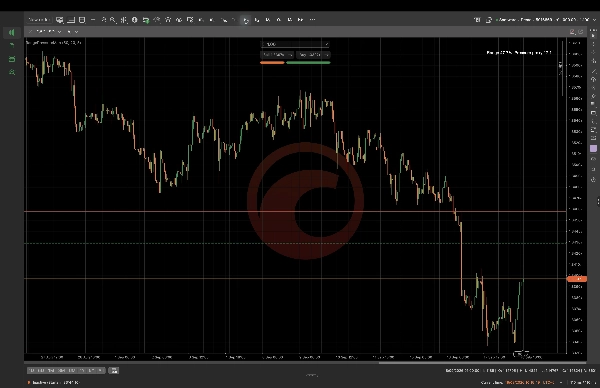
レンジプレッシャーマップは、ルックバック範囲を計算し、レンジの高値、レンジの中間値、レンジの安値を現在の価格位置および決定論的なティックボリューム圧力の代理指標と共に表示します。チャートのコンテキストに合わせて、レンジのルックバック、圧力のルックバック、およびEMAの長さを設定してください。これは裁量的なチャート分析のために設計されており、注文フロー、実際の市場ボリューム、買い手または売り手の活動、予測、または自動取引の実行を表すものではありません。値は選択されたシンボル、時間枠、パラメータ、および利用可能なデータに依存します。

概要

AIによる概要
Range Pressure Map is a cTrader indicator that calculates a lookback range and visually displays the Range High, Range Mid, and Range Low levels on your chart. It also shows the current price location within this range alongside a deterministic tick-volume pressure proxy, which serves as an estimate of market pressure based on tick volume data. Users can customize parameters including range lookback period, pressure lookback, and EMA length to align with their specific chart context. This tool is intended for discretionary chart analysis and does not provide order flow data, real market volume, buyer or seller activity, predictive signals, or automated trade execution. Its outputs depend on the selected trading symbol, timeframe, and input parameters. The indicator supports visualization of support and resistance levels combined with volume-based pressure insights to assist traders in analyzing price action within defined ranges.
インジケーターのプロフィール
インジケーターのカテゴリー
サポート&レジスタンス
出力の種類
ビジュアル表示
データ要件
バーのみ

ディスカッション

カスタマーレビュー

5.0
レビュー: 2
5
100 %
4
0 %
3
0 %
2
0 %
1
0 %
カスタマーレビュー
October 20, 2026
Range Pressure Map provided a clean and consistent range view on EURUSD and XAUUSD across H1 and M1. High, Mid and Low levels were clearly plotted, while the displayed range percentage matched the visible price location well. The pressure proxy added context without cluttering the chart or being presented as true order flow. Score 4,7/5
October 7, 2026
A range high, midpoint and low put the pressure proxy in a clear setting. Lookback and EMA controls make the view adjustable, and the description is upfront about using tick volume rather than real buyer and seller flow. That honesty makes the map easier to interpret.

よくあるご質問

EMA
Volume
cTrader Storeで入手可能な取引ボット、インジケーター、プラグインなどの商品は、第三者の開発者が提供するものであり、情報と技術の取得のみを目的としてご利用いただけます。cTrader Storeはブローカーではなく、投資助言や個人的な推奨を行うことも、将来のパフォーマンスを保証することもありません。
この作成者の他の商品

インジケーター
BOS
MSS
+4
See confirmed BOS, CHOCH and SWEEP structure events on your cTrader chart.
インジケーター
BOS
Add standard-timeframe context candles to a native Renko chart.
インジケーター
Channel
Key Levels
+1
Monitor a selected chart trendline and confirm breaks on candle close.
デスクトッププラグイン
Trade Journal
Trade Statistics
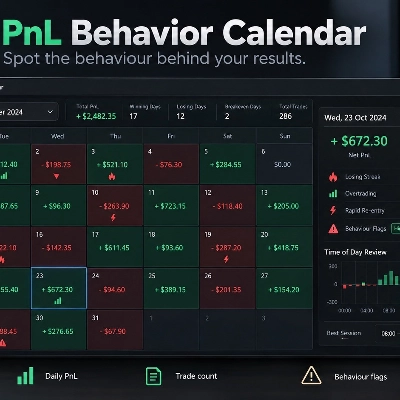
Review daily PnL, trade counts, losing streaks and rapid re-entry from your cTrader history.
デスクトッププラグイン
Chart UI Tools
Keep lines, zones and channels synced across selected same-symbol charts from one desktop plugin.
cBot
Drawdown Guard
Daily Loss Limit
Monitor account-wide loss and stop-loss risk budgets, with optional order cancellation and post-fill closure.
デスクトッププラグイン
Position Sizer
Risk Calculator
Size manual trades from your risk settings and review Market, Limit or Stop orders before execution.
インジケーター
Volume
Key Levels
View tick activity across a selected chart range with Point of Control, Value Area High and Value Area Low.

これも好きかも

インジケーター
Spread Filter
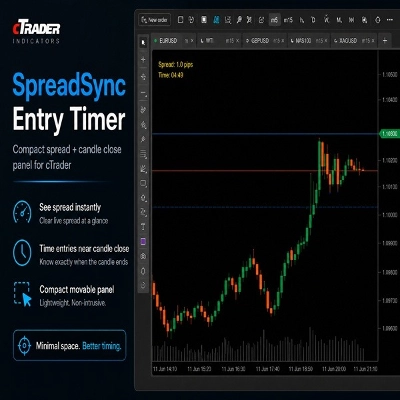
SpreadSync Entry Timer is a compact cTrader indicator that shows live spread and candle-close.
インジケーター
Pin Bar
Inside Bar
+2
Advanced candlestick pattern recognition with structural quality scoring, alerts and adaptive chart visuals.
インジケーター
Doji
Wedge
+5
Angora Pattern Recognition is a cTrader indicator that finds, draws and tracks classic chart patterns automatically.
インジケーター
Forex
Crypto
+3
Perfect Trend
インジケーター
Volume
Key Levels
View tick activity across a selected chart range with Point of Control, Value Area High and Value Area Low.
インジケーター
RSI
SMC
+17
Turn WaveTrend Cross into a BTC profit machine precise buy sell signals, smart momentum edge, no lag trading system
インジケーター
EMA
RSI
+5
MACD Colour Histogram with 11 Moving Average Types, Multi-timeframe confirmation and Sound Signal Alert.
インジケーター
SMC
Prop
+4
📈 Trading Sessions Indicator — London, New York & Tokyo Visualize Key Market Sessions + High/Low Levels with Precision
インジケーター
Key Levels
Market Structure
+1
Sessions, ICT killzones, multi-ORB and previous levels. One clean, no-repaint cTrader overlay.
インジケーター
ATR
Volume
+2
Nine timeframe cards, vivid candles, native BUY/SELL arrows and adjustable ATR-buffer stop-loss reference lines.
インジケーター
VWAP
Support & Resistance
Trading.FC$_vwap Algo shows VWAP trends, dynamic support/resistance and deviation bands to spot potential trade entries.
インジケーター
BOS
CHOCH
+2
The full SMC suite: BOS / CHoCH / MSS, FVG, liquidity, order blocks and a 0-100 confluence score. No repaint.
インジケーター
Area of Interest with the power of AI to detect the market interest.
インジケーター
ATR
Prop
+15
Initial Range – Where the open writes the script.
インジケーター
Signal
Stocks
+5
🚀 Automated Elliott Wave & Fibonacci tool for cTrader. Spot trends, corrections & retracements fast.
インジケーター
SMC
VWAP
+16
It calculates Anchored VWAP and StdDev bands from a user-defined start date for cTrader charts.
インジケーター
VWAP
Volume
+2
VWAP Bands and Swing Wick Structure Indicator
インジケーター
VWAP
Volume
+4
Advanced Order Flow & Volume Profiling for cTrader. Unveil institutional footprints, Delta, and Anchored VWAPs.

価格

登録日 16/09/2026