

Descrizione
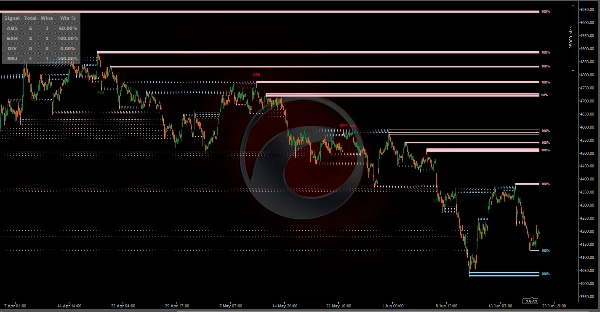
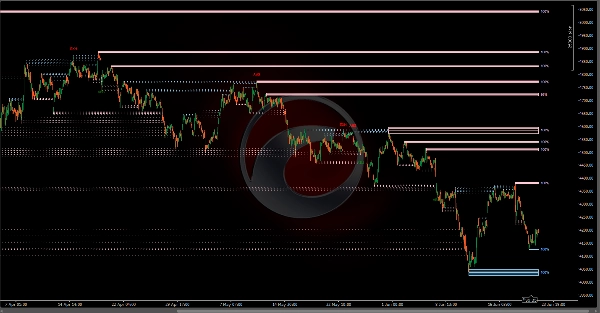
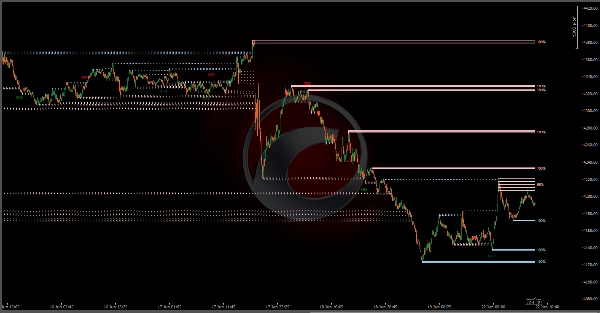
Lo strumento Liquidity Profiler Tools è un indicatore che identifica i principali livelli di liquidità lato acquisto e lato vendita e visualizza l'attività interna di acquirenti/venditori attraverso quadranti riempiti con delta di volume, fornendo un set completo di strumenti per analizzare le spazzate di liquidità e i potenziali ribaltamenti.
Rilevamento
L'indicatore utilizza un sistema di rilevamento basato sui pivot. Quando un massimo oscillante è confermato, viene creata una zona di Liquidità Lato Acquisto (BSL); un minimo oscillante crea una zona di Liquidità Lato Vendita (SSL). Lo script include una logica "Filtra Sovrapposizioni" per garantire la chiarezza del grafico. Se si forma un nuovo pivot più significativo all'interno dell'intervallo di una zona attiva esistente, lo strumento può aggiornarsi automaticamente al livello più rilevante, evitando l'ingombro di molteplici riquadri sovrapposti.
Questo strumento suddivide ogni zona in quattro quadranti orizzontali. Man mano che il prezzo si muove all'interno di questi quadranti, lo script calcola il delta di volume (la differenza tra pressione di acquisto e vendita) per ciascuna sezione specifica.
Zone di Acquisto: Indica che acquirenti aggressivi sono stati più attivi in quella specifica fascia di prezzo.
Zone di Vendita: Indica che venditori aggressivi hanno dominato quella sezione.
Rilevamento del Ribaltamento
Lo script include un sistema di rilevamento che identifica modelli di volume insoliti durante le spazzate di liquidità. Questi segnali sono mostrati come testo come segue:
-
- ABS (Assorbimento): Si verifica quando ordini di mercato aggressivi al limite estremo di una zona vengono assorbiti da grandi ordini limite nella direzione opposta.
- EXH (Esaurimento): Si verifica quando una spazzata avviene con un volume relativo molto basso, suggerendo l'assenza di seguito.
- DIV (Divergenza): Identificata quando un alto volume spinge al limite di una zona (FOMO) ma il prezzo non riesce a chiudere al di fuori del livello.
- REJ (Rifiuto di Ritorno): Scatenato quando una candela di spazzata mostra un alto delta nella direzione opposta alla spazzata e chiude nuovamente all'interno della zona.
Dashboard:
L'indicatore include una dashboard in tempo reale che traccia la performance storica di ogni tipo di segnale di ribaltamento utilizzando una logica di validazione basata sul tempo.
Vittoria registrata se entro la Finestra di Valutazione, il prezzo si ribalta dalla spazzata e rimane in profitto (dal lato corretto dell'ingresso del segnale) per un numero specifico di barre consecutive (Tempo di Mantenimento).
Decadimento della Zona (Salute):
Le zone attive presentano un'etichetta percentuale di "Salute". Questa traccia il volume cumulativo scambiato all'interno della zona rispetto alla sua capacità. Man mano che più volume viene scambiato a questi livelli, la liquidità è considerata "consumata" e la percentuale scende verso lo 0%.
Impostazioni dell'Indicatore
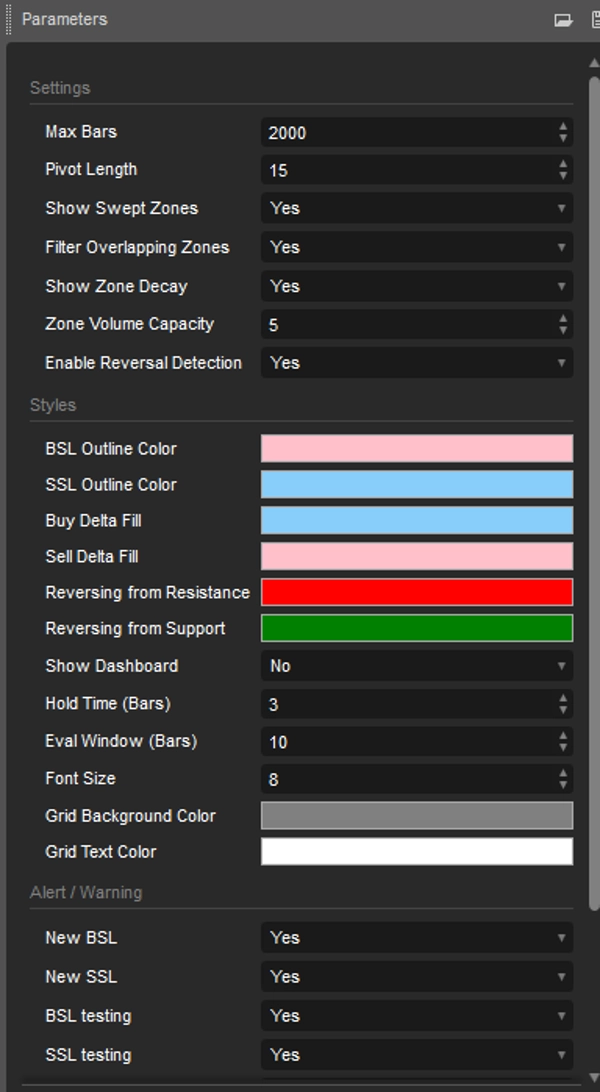
Impostazioni Principali
- Lunghezza Pivot: Periodo di lookback/lookforward per rilevare massimi e minimi oscillanti.
- Max Barre: L'indicatore inizia a calcolare basandosi sul numero di candele storiche.
- Mostra Zone Spazzate: Mantiene le zone visibili con contorni tratteggiati dopo che sono state violate.
- Filtra Zone Sovrapposte: Previene la creazione di nuove zone che si sovrappongono a zone attive esistenti.
Decadimento & Ribaltamenti
- Mostra Decadimento Zona: Attiva/disattiva le etichette percentuali di salute.
- Capacità Volume Zona: Moltiplicatore per il volume medio per determinare quanto volume una zona può assorbire.
- Abilita Rilevamento Ribaltamento: Attiva/disattiva le bolle di segnale per i modelli di ribaltamento.
Dashboard
- Mostra Dashboard: Attiva/disattiva la tabella di monitoraggio delle performance.
- Tempo di Mantenimento (Barre): Numero di barre consecutive in cui il prezzo deve rimanere in profitto per essere considerato un ribaltamento riuscito.
- Finestra di Valutazione (Barre): Numero massimo di barre che lo script attende per la manifestazione di un ribaltamento.
Stili e Avvisi
- Stili: Regola la configurazione del colore degli oggetti. Nascondi/Mostra Dashboard.
- Avviso: Attiva/disattiva gli avvisi ogni volta che BSL&SSL viene rilevato/migrato/testato/ribaltato.
Riepilogo
The tool also detects potential reversal signals during liquidity sweeps, displaying four types of volume-based patterns: Absorption (ABS), Exhaustion (EXH), Divergence (DIV), and Snapback Rejection (REJ). These signals help identify unusual volume behavior that may precede price reversals.
A real-time dashboard tracks the historical performance of reversal signals, validating them based on price action within a user-defined evaluation window and hold time. Active zones feature a "Health" metric indicating the extent of volume consumed relative to zone capacity, reflecting liquidity depletion.
Users can customize settings including pivot length, volume capacity, zone visibility, reversal detection toggles, and dashboard display. The indicator supports visualization of liquidity sweeps and reversals, aiding analysis of support and resistance levels through volume and order flow insights.










![Logo di "[CB] Pivot Points Pro"](https://cdn.ctrader.com/image/webp/43463c82-67b0-4f10-a4ba-901bba091d81_32594)
















