present
Daftar dan dapatkan diskon $50 untuk pembelian pertama Anda
Trading product for Tape Reading Start v2  Indikator Volume Support & Resistance, image 1
Tape Reading Start v2
Indikator
6 unduhan
Versi 1.0, May 2026
Windows, Mac
Trading product for Tape Reading Start v2  Indikator Volume Support & Resistance, image 2
Trading product for Tape Reading Start v2  Indikator Volume Support & Resistance, image 3
Sejak 20/09/2024
143
Penjualan
18.34K
Instal gratis

Deskripsi

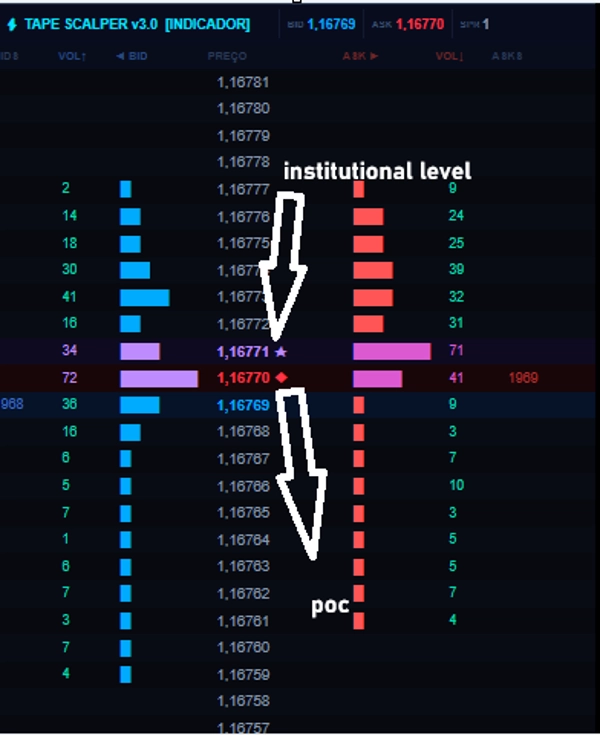
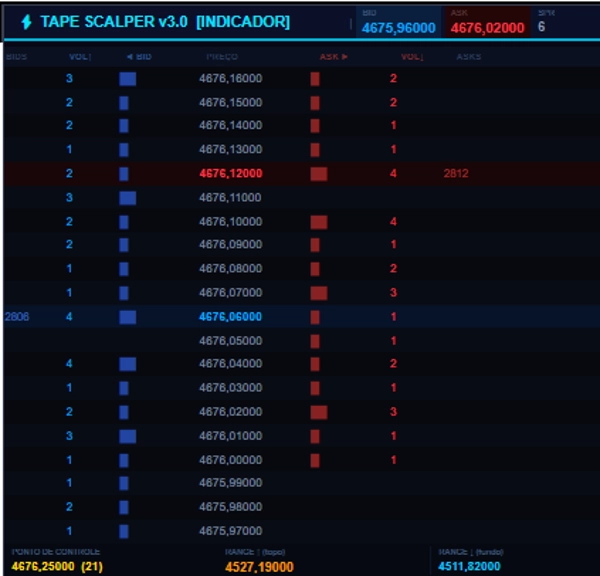
Indikator Pembacaan Tape: Berdasarkan aliran urutan pembacaan secara real time.


Informasi berdasarkan Garis Harga:

HARGA: Nilai tepat dari level harga.


VOL↑ dan VOL↓: Angka mentah yang menunjukkan berapa banyak tick agresif (beli atau jual) yang terjadi pada harga tersebut dalam jendela analisis.


Batang (◄ BID dan ASK ►): Batang dengan lebar variabel yang memudahkan perbandingan visual volume. Semakin lebar batang, semakin besar volumenya.


BIDS / ASKS (simulasi): Nilai yang dihasilkan oleh indikator untuk mensimulasikan likuiditas, berdasarkan harga saat ini.


Sorotan Visual: Kode menerapkan warna dan simbol khusus untuk peristiwa penting:


Harga Saat Ini (BID/ASK): Garis harga Bid berubah menjadi biru tua, dan garis Ask berubah menjadi merah tua.


◆ (Berlian): Menunjukkan POC (Point of Control) – level harga dengan volume terakumulasi tertinggi dalam periode tersebut.


★ (Bintang): Menunjukkan bahwa volume pada level tersebut adalah Institusional (di atas ambang yang dikonfigurasi).


← (Panah): Menunjukkan bahwa harga saat ini berada di batas Rentang (Atas atau Bawah) yang ditentukan untuk strategi Breakout.


Warna Batang dan Angka:


Sian / Biru Muda: Volume Beli Normal.


Merah / Merah Muda: Volume Jual Normal.


Hijau / Kuning: Volume sangat tinggi (HiVol).


Ungu / Lilac: Volume yang diklasifikasikan sebagai Institusional.


4. STATSROW (Baris Statistik Bawah)

Menampilkan tiga metrik kontekstual penting untuk analisis pembacaan tape.


Kode Metrik Nama Apa artinya

POINT OF CONTROL POC Level harga dengan total volume terakumulasi tertinggi (jumlah beli dan jual). Menampilkan harga dan total volume

RANGE↑ (atas) Range High Harga tertinggi dalam rentang yang ditentukan oleh periode batang (misalnya, 20 batang terakhir).


RANGE↓ (bawah) Range Low Harga terendah dalam rentang yang ditentukan oleh periode batang.

Ringkasan untuk Portofolio Penjualan

Saat menyajikan indikator ini sebagai produk, Anda harus menyoroti informasi berikut yang hanya terlihat di dashboard:


Visualisasi Aliran Pesanan Real-Time: Lihat pertarungan antara pembeli dan penjual level demi level.


Identifikasi Level Institusional (★): Bedakan "uang pintar" dari ritel langsung di tangga harga.


Point of Control (POC) Dinamis (◆): Ketahui dengan tepat di mana volume sedang terkonsentrasi saat ini.


Deteksi Breakout Visual (←): Lihat langsung di tangga saat harga menyentuh tepi rentang yang telah ditentukan.

COBA VERSI PRO: https://ctrader.com/products/4282


Ringkasan

Ringkasan AI
Tape Reading Start v2 is a tape reading indicator designed for real-time order flow analysis on price levels. It visualizes the interaction between buyers and sellers by displaying aggressive buy and sell ticks (VOL↑ and VOL↓) at each price within a defined analysis window. The indicator uses variable-width bars to represent volume magnitude, with wider bars indicating higher volume.

Key features include simulated bid and ask liquidity values, visual highlights for important events, and color-coded volume bars: cyan/light blue for normal buy volume, red/pink for normal sell volume, green/yellow for exceptionally high volume, and purple/lilac for institutional volume. Special symbols mark the Point of Control (◆) representing the price level with the highest accumulated volume, institutional volume levels (★), and breakout range limits (←).

A lower statistics row provides contextual metrics such as the Point of Control (POC), Range High (RANGE↑), and Range Low (RANGE↓) over the selected bar period. The indicator supports visualization of institutional activity and breakout detection directly on the price ladder, aiding in detailed tape reading and volume-based market analysis. It requires tick data and outputs visual signals including level touches, breaks, and reversals.
Profil indikator
Kategori indikator
Alur order/DOM
Tipe output
Visualisasi
Sinyal
Persyaratan data
Data tick
Sinyal yang didukung
Level tersentuh
Level tertembus
Reversal

Diskusi

Ulasan pelanggan

0.0
Ulasan: 0
Ulasan pelanggan
Belum ada ulasan untuk produk ini. Sudah mencobanya? Jadilah pemberi ulasan pertama!

Pertanyaan umum

Volume
Support & Resistance
Produk-produk yang tersedia melalui cTrader Store, termasuk bot trading, indikator, dan plugin, disediakan oleh pengembang pihak ketiga serta hanya ditujukan untuk akses teknis dan informasi. cTrader Store bukan broker dan tidak menyediakan saran investasi, rekomendasi pribadi, atau jaminan apa pun tentang kinerja di masa mendatang.

Produk lain dari penulis ini

Logo "Smart Trading Bots"
Peringkat teratas
4.0
(5)
Gratis
cBot
Forex
BTCUSD
+5
Intelligent negotiations and analysis!This robot is 50% automatic.
47.3%
ROI
3
Faktor laba
cBot
XAUUSD
Scalping
Precision Scalper,XAUUSD ,Averages that functions like a multidimensional radar:
34.8%
ROI
2.12
Faktor laba
Indikator
Order BlockIndicator reversal
cBot
ATR
RSI
+4
Intelligent system, Available any instrument. Profit 12. Drawdown 1%
12.29
Faktor laba
Indikator
Forex
Fair Value Gap
Volume Profile Price Period and Live VAH,VAL,POC,
cBot
RSI
MACD
+2
Chart Patterns Algo Bot
Indikator
SMC
Prop
+12
BoS ChoCH Pro,Strict Mode,False Breakout Filter,Average hit rate: 72-78%
cBot
AI
XAUUSD
POSITION 5000 Pips: The Ultimate Algorithm for Gold
54%
ROI
5
Faktor laba
Indikator
PVA Volume Analysis Indicator:Price volume over trend strength and direction
Indikator
Forex
BTCUSD
+5
INDICATOR,LIQUIDITY POOLS,ACCURATE SIGNAL, NO DELAY,80% PROBABILITY
Indikator
Signal
Indicator,combines with several strategies.MA locate trends,pullback, signal volumes, reversals, support and resistance
cBot
EMA
BTCUSD
+5
Precision Scalper Bots QUANT ,XAUUSD ,
13.8%
ROI
3
Faktor laba

Anda mungkin juga suka

Indikator
Forex
Crypto
+2
Daily Fibo
Logo "Major Tops and Bottoms"
Peringkat teratas
4.2
(4)
$29
Indikator
Signal
Scalping
Average accuracy of around 60% to 70% on 45min timeframes it is highly recommended to use stop losses
Indikator
MSS
Key Levels
+2
Marks liquidity zones at swing highs/lows, tracks touches, and confirms breaks to improve entries and structure clarity.
Indikator
Fibonacci
Key Levels
+1
Explore Elliott wave counts, three swing sizes and example levels with an interactive cTrader chart panel.
Indikator
Prop
Forex
+2
Vision - Advanced Session Indicator
Indikator
VWAP
Forex
+5
Trade with institutional accuracy. Identify fair price levels and high-volume zones instantly!
Indikator
SMC
Prop
+15
Automatic Elliott Wave Detection with Professional Filters
Indikator
Breakout
Allow trader to visualize Support & Resistance across different timeframes,give trader an overview of the current market
Indikator
AI
ATR
+10
FX Sniper: Multi-pair Forex analysis tool. Features trend logic, adaptive pivots, and momentum filtering for major pairs
Indikator
ATR
Scalping
+1
Auto Fibonacci Retracement Pro – Smart Swing & Golden Zone Levels
Indikator
Prop
Forex
+4
HMA MTF 2.0 (Multi-Timeframe )
Indikator
ATR
BOS
+5
Opening ranges, dynamic trend channels, and multi-scale breakout/retest analysis for clear intraday chart decisions.
Indikator
ZLSMA: Zero-lag trend indicator! Catch trends fast with customizable settings. Boost your trading precision.
Indikator
BOS
EMA
+5
Market structure signals graded A to C, each with a drawn trade plan, plus an adaptive trend ribbon and a trend matrix
Indikator
Drawdown Monitor
Protect your funded account. Real-time Daily Equity Drawdown monitor with Green / Orange / Red flashing alerts.
Indikator
AI
Forex
+5
Dynamic, color‑coded candles reveal market shifts instantly—spot momentum and trend reversals at a glance
Indikator
XAUUSD
Professional Volume Profile Indicator - Shows volume distribution, POC, Value Areas & Buy/Sell pressure.
Indikator
Prop
Forex
+10
Heatmap Pro analiza la volatilidad, el volumen y la acción del precio para "pintar" tu gráfico con zonas de color.

Harga

Sejak 20/09/2024
143
Penjualan
18.34K
Instal gratis