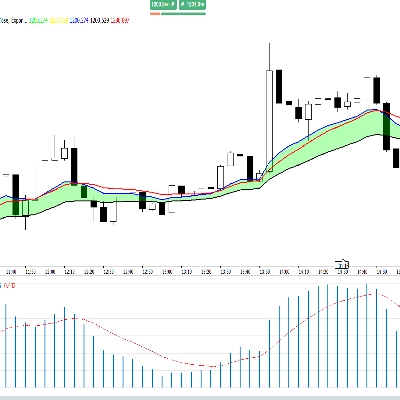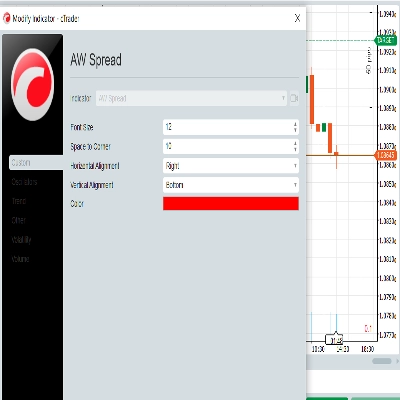
present
Sign up and get $50 off your first purchase
Trading product for IR Spread Indicator, image 1
IR Spread
5.0
Reviews: 2
5.66K
Free installs

Description

show spread on chart update

Telegram Channle support us for more free indicator and bot

Summary

AI summary
IR Spread is a trading indicator designed to display the spread directly on the chart during updates. It provides real-time visualization of the spread, helping traders monitor this key metric within their trading platform interface. The indicator integrates seamlessly with chart updates, ensuring that spread information is current and easily accessible.
Indicator profile

Discussion

Customer reviews

5.0
Reviews: 2
5
100 %
4
0 %
3
0 %
2
0 %
1
0 %
Customer reviews
June 4, 2026
didn't check deep enough so far but it seems perfect and smooth
November 18, 2025

FAQ

Products available through cTrader Store, including trading bots, indicators and plugins, are provided by third-party developers and made available for informational and technical access purposes only. cTrader Store is not a broker and does not provide investment advice, personal recommendations or any guarantee of future performance.
More from this author

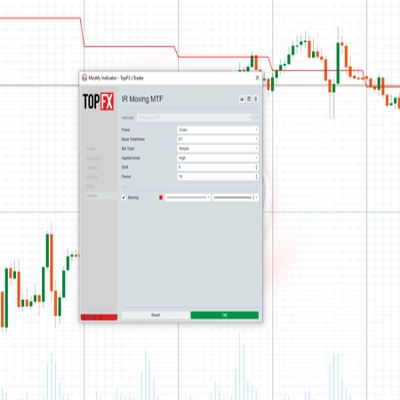
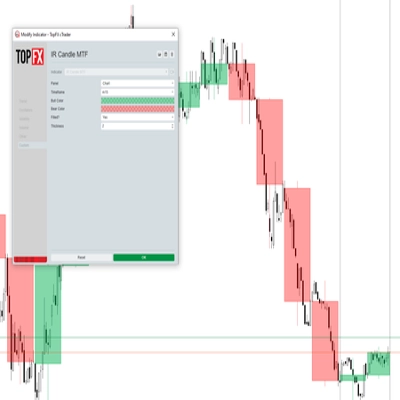
with this indicator you could see other time frame candle in your chart.
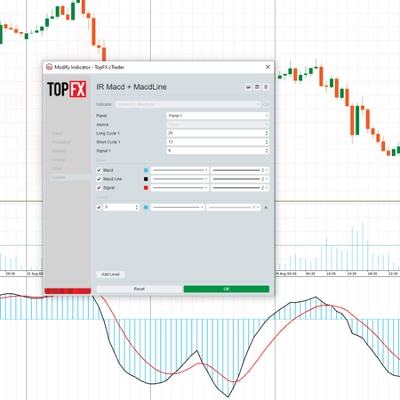
some user add moving average to macd to see better. in ctrader 4.3.11 there is a problem with this . I make a macd tha
this indicator show macd on chart.
Multi Time Frame Moving Average is a powerful and flexible indicator for cTrader
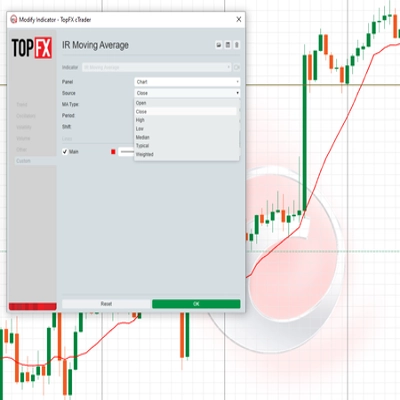
 this moving include everything that a trader needs from Moving Average.
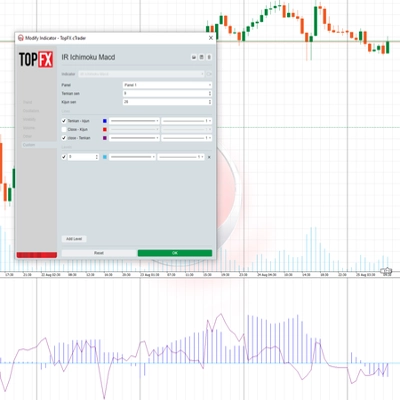
this indicaotr show distance between Tenkan to Kijun, Close to Kijun and Close to Tenkan 
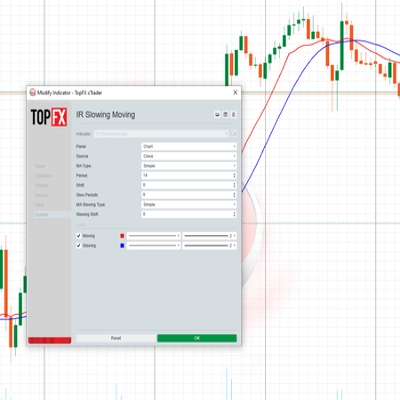
Add Slowing to IR Moving Average.
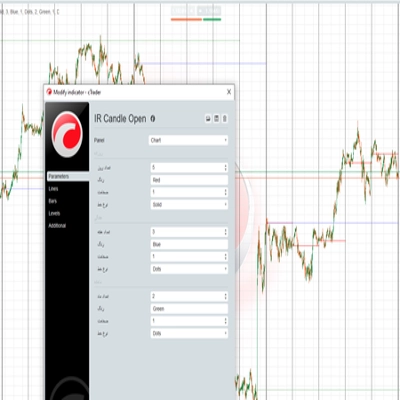
IR Candle Open plots customizable opening price lines for daily, weekly, and monthly candles
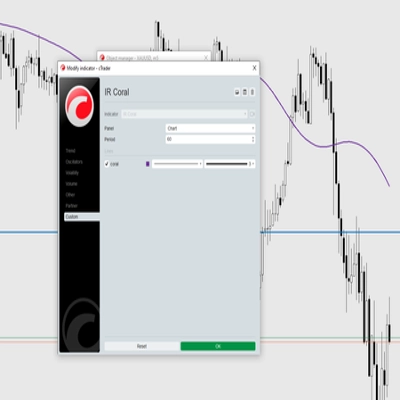
Coral indicator
you could put your check list in your chart you could split your test with “,” you could put your checklist in indicat
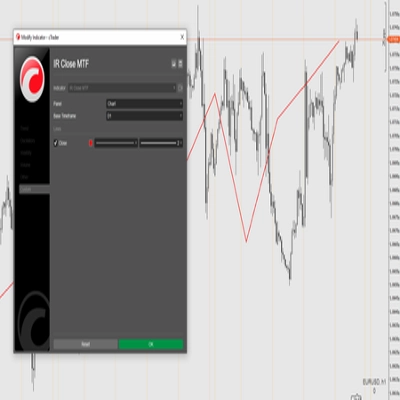
this indicator show other time frame close in lower time frame. for ex: show daily close in m 15.
don't move to the end of chart after timeframe changing. it should be better to use for near history. for long history

You may also like

This indicator combines two independent analytical engines into a single overlay on your chart.
Smart Money Concepts (SMC) indicator with real-time Fair Value Gap (FVG) boxes, $50 round numbers, and live market HUD.
Explore 88 harmonic price-pattern variants with interactive chart controls and geometric reference levels.
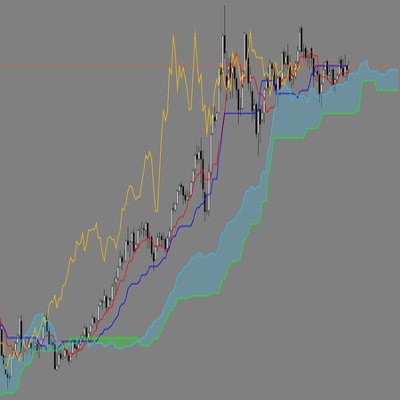
Ichimoku Kinkō Hyō with fixed shift to 25 as Ctrader calculate it from 0 and values was wrong for Chikou Span and Kumo.
PRO Liquidity Sweep + FVG Combo detector with custom Gold/Blue signals & alerts
Real-Time Candlestick Pattern Detection with Custom Alerts & Trend Analysis for cTrader
The levels you mark each morning, drawn and followed: PDH/PDL, weekly, monthly, sessions, equal highs/lows.
“Dynamic Swing VWAP — Structure-Anchored, Volatility-Adaptive, Market-Ready.” 🚀
Map market structure, order blocks, liquidity and key zones with an interactive cTrader dashboard.
Introducing High Accuracy multi timeframe Swing high and low detector.
VMM Average Median - Advanced Median Indicator with Smart Trend Detection.
Delta RSI Candle Pro, the indicator that transforms ordinary candlesticks into powerful momentum visualizers.
Multi-Time Frame Candlesticks FVG with BSL/SSL Premium Suite
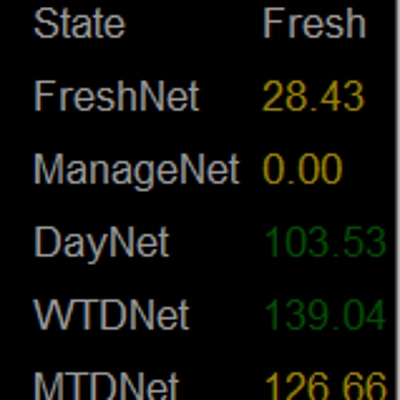
Personal trade tracker for a single symbol. Clear net profit summary — FreshNet, ManageNet, DayNet, WTDNet, MTDNet.
Initial Range – Where the open writes the script.
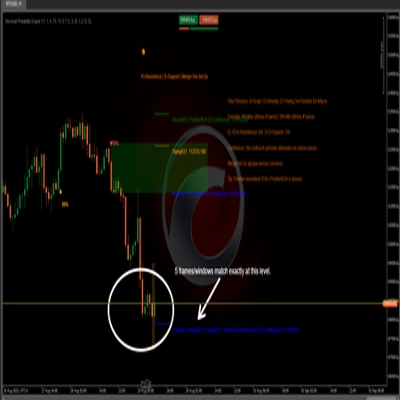
Detecting reversal zones + multidimensional mapping of support and resistance "Golden Levels.
Bar Close Alert Manager provides real-time alerts for bar closures with customizable notifications and automation.
This indicator works best as a trend-confirmation tool—wait for multiple signals!

Price

5.66K
Free installs