
IR Macd on Chart
지표
416 다운로드
버전 1.0, Jan 2025
Windows, Mac
5.0
리뷰: 1
설명
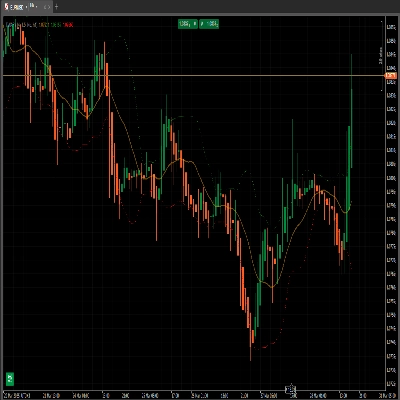
이 지표는 차트에 MACD를 표시합니다.
요약
AI 요약
IR Macd on Chart is a trading indicator that displays the Moving Average Convergence Divergence (MACD) directly on the price chart. It provides a visual representation of the MACD, a momentum indicator used to identify trend direction and potential reversals by showing the relationship between two moving averages of a security’s price. This indicator integrates the MACD histogram and signal line within the chart interface, enabling traders to analyze momentum without switching views. It supports standard MACD functionality and is categorized under momentum indicators.
지표 프로필
고객 리뷰
5.0
리뷰: 1
5 | 100 % | |
4 | 0 % | |
3 | 0 % | |
2 | 0 % | |
1 | 0 % |
상담
자주 묻는 질문(FAQ)
MACD
트레이딩 봇, 지표, 플러그인 등 cTrader Store에서 제공되는 상품은 제3자 개발자에 의해 제공되며, 이는 단순히 정보 및 기술적 접근을 목적으로 제공된 것입니다. cTrader Store는 중개인이 아니며, 투자 조언, 개인별 추천 또는 향후 성과에 대한 어떠한 보장도 제공하지 않습니다.


!["Gaussian Channel [Iridio Capital]" 로고](https://cdn.ctrader.com/image/webp/7c039209-5573-4a54-a072-f9528b503103_41960)

가격
5.12K
무료 설치