
Opis
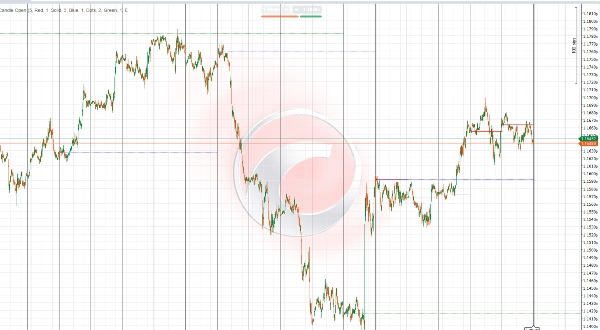
IR Candle Open Indicator to wszechstronne i konfigurowalne narzędzie, które rysuje ceny otwarcia świec tygodniowych, dziennych i miesięcznych na Twoim wykresie handlowym. Traderzy mogą wybrać liczbę okresów (dni, tygodni, miesięcy) do wyświetlenia, co umożliwia elastyczną analizę wieloczasową dostosowaną do ich strategii.
Kluczowe cechy obejmują:
- Precyzyjne rysowanie otwarć świec dla użytkownikowo zdefiniowanej liczby okresów dziennych, tygodniowych i miesięcznych.
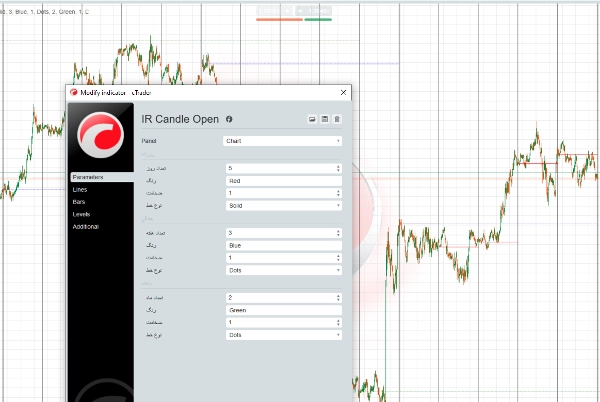
- Konfigurowalne style linii: użytkownicy mogą wybrać typ linii (ciągła, przerywana, kropkowana), kolor i grubość dla lepszej czytelności wykresu.
- Obsługa wizualizacji wieloczasowej, pomagająca zidentyfikować ważne poziomy cenowe w różnych horyzontach czasowych.
- Pomaga w wykrywaniu potencjalnych stref wsparcia i oporu na podstawie tych kluczowych cen otwarcia.
- Kompatybilny z różnymi rynkami, takimi jak Forex, towary, indeksy i kryptowaluty.
Ta elastyczność pozwala traderom dostosować wyświetlanie wskaźnika do swoich osobistych preferencji i stylu handlu, zwiększając przejrzystość i poprawiając podejmowanie decyzji na podstawie kluczowych poziomów cen.
توضیح فارسی (بهروز شده)
اندیکاتور IR Candle Open ابزاری منعطف و قابل تنظیم است که قیمتهای باز شدن کندلهای هفتگی، روزانه و ماهیانه را روی نمودار معاملاتی شما نمایش میدهد. کاربران میتوانند تعداد دورههای روزانه، هفتگی و ماهیانه که میخواهند خطوط آنها نمایش داده شود را انتخاب کنند تا تحلیل چندتایمفریمی متناسب با سبک معاملاتی خود داشته باشند.
ویژگیهای کلیدی:
- نمایش دقیق خطوط قیمت باز شدن کندلها برای تعداد دورههای دلخواه در تایمفریمهای روزانه، هفتگی و ماهیانه.
- امکان انتخاب نوع خط (ساده، خطچین، نقطهچین)، رنگ و ضخامت خطوط برای بهبود وضوح و خوانایی نمودار.
- پشتیبانی از تحلیل چندتایمفریمی جهت شناسایی سطوح مهم قیمتی در بازههای زمانی مختلف.
- کمک به تشخیص سطوح حمایت و مقاومت احتمالی بر اساس این نقاط کلیدی باز شدن قیمتها.
- مناسب برای استفاده در بازارهای مختلف مانند فارکس، کالاها، شاخصها و رمزارزها.
این قابلیتها به تریدرها امکان میدهد تا نمایش اندیکاتور را بر اساس سلیقه و سبک معاملاتی خود تنظیم کنند و با وضوح بیشتر، تصمیمات بهتری بگیرند.
Podsumowanie
Opinie klientów
5 | 100 % | |
4 | 0 % | |
3 | 0 % | |
2 | 0 % | |
1 | 0 % |


