Opis
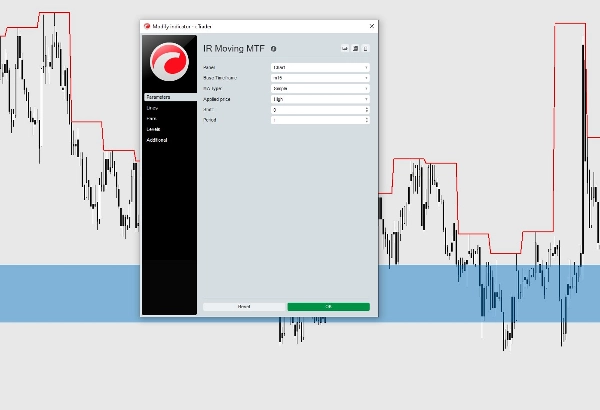
Multi Time Frame Moving Average is a powerful and flexible indicator for cTrader that allows you to display a Moving Average calculated from any timeframe directly on your current chart.
Unlike the standard Moving Average indicator, this version provides advanced customization options, making it suitable for traders who use multi-timeframe analysis in their trading strategies.
Features
- Display a Moving Average from any timeframe on the current chart.
- Supports multiple Moving Average methods:
- Simple (SMA)
- Exponential (EMA)
- Smoothed (SMMA)
- Linear Weighted (LWMA)
- Wilder's
- Choose from various price sources:
- Close
- Open
- High
- Low
- Median Price
- Typical Price
- Weighted Price
- Adjustable Moving Average period.
- Shift (Offset) the Moving Average forward or backward.
- Fully customizable colors, thickness, and line style.
- Accurate multi-timeframe calculation with smooth visualization.
- Works on all symbols and all timeframes.
Ideal For
This indicator is especially useful for traders who:
- Trade using multi-timeframe analysis.
- Use higher timeframe trends for entry confirmation.
- Want to monitor dynamic support and resistance levels.
- Combine Moving Averages with Price Action strategies.
Whether you are a scalper, day trader, or swing trader, this indicator helps you visualize higher timeframe market direction without switching between charts.
To support us for more free indicator please use below link and sign up in broker
🇮🇷 توضیحات فارسی
مووینگ اوریج مولتی تایمفریم
اندیکاتور Multi Time Frame Moving Average یک ابزار حرفهای برای cTrader است که به شما امکان میدهد مووینگ اوریج هر تایمفریمی را مستقیماً روی چارت فعلی نمایش دهید.
برخلاف مووینگ اوریج پیشفرض سیتریدر، این اندیکاتور امکانات بیشتری برای شخصیسازی در اختیار شما قرار میدهد و برای معاملهگرانی که از تحلیل چند تایمفریمی استفاده میکنند بسیار کاربردی است.
امکانات
- نمایش مووینگ اوریج هر تایمفریم روی چارت فعلی
- پشتیبانی از انواع مووینگ اوریج:
- SMA
- EMA
- SMMA
- LWMA
- Wilder's Moving Average
- انتخاب نوع قیمت محاسبه:
- Close
- Open
- High
- Low
- Median Price
- Typical Price
- Weighted Price
- قابلیت تنظیم دوره (Period)
- امکان جابهجایی (Shift/Offset) مووینگ اوریج به جلو یا عقب
- تنظیم کامل رنگ، ضخامت و استایل خط
- محاسبات دقیق در حالت Multi Time Frame
- قابل استفاده روی تمام نمادها و تمام تایمفریمها
مناسب برای
این اندیکاتور برای معاملهگرانی مناسب است که:
- از تحلیل چند تایمفریمی استفاده میکنند.
- روند تایمفریمهای بالاتر را برای تأیید ورود بررسی میکنند.
- از مووینگ اوریج بهعنوان حمایت و مقاومت داینامیک استفاده میکنند.
- استراتژی معاملاتی آنها بر پایه Price Action و Moving Average است.
این ابزار به شما کمک میکند بدون نیاز به جابهجایی بین تایمفریمها، روند تایمفریمهای بالاتر را مستقیماً روی نمودار فعلی مشاهده کنید.