Açıklama
Çoklu Zaman Dilimi Hareketli Ortalama, mevcut grafiğinizde herhangi bir zaman diliminden hesaplanan Hareketli Ortalama'yı doğrudan görüntülemenizi sağlayan güçlü ve esnek bir cTrader göstergesidir.
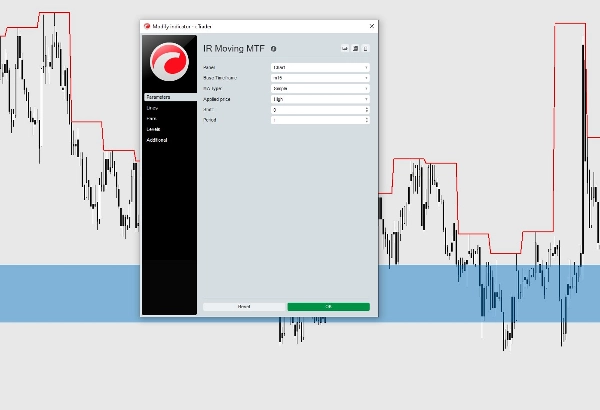
Standart Hareketli Ortalama göstergesinin aksine, bu sürüm gelişmiş özelleştirme seçenekleri sunar ve çoklu zaman dilimi analizini ticaret stratejilerinde kullanan tüccarlar için uygundur.
Özellikler
- Mevcut grafikte herhangi bir zaman diliminden Hareketli Ortalama gösterin.
- Birden fazla Hareketli Ortalama yöntemini destekler:
-
- Basit (SMA)
- Üssel (EMA)
- Yumuşatılmış (SMMA)
- Doğrusal Ağırlıklı (LWMA)
- Wilder's
- Çeşitli fiyat kaynaklarından seçim yapın:
-
- Kapanış
- Açılış
- Yüksek
- Düşük
- Medyan Fiyat
- Tipik Fiyat
- Ağırlıklı Fiyat
- Ayarlanabilir Hareketli Ortalama periyodu.
- Hareketli Ortalama'yı ileri veya geri kaydırın (Ofset).
- Tamamen özelleştirilebilir renkler, kalınlık ve çizgi stili.
- Pürüzsüz görselleştirme ile doğru çoklu zaman dilimi hesaplaması.
- Tüm semboller ve tüm zaman dilimlerinde çalışır.
İdeal Kullanım
Bu gösterge özellikle şu tür tüccarlar için faydalıdır:
- Çoklu zaman dilimi analizi kullanarak işlem yapanlar.
- Giriş onayı için daha yüksek zaman dilimi trendlerini kullananlar.
- Dinamik destek ve direnç seviyelerini izlemek isteyenler.
- Hareketli Ortalamaları Fiyat Hareketi stratejileriyle birleştirenler.
İster scalper, ister günlük tüccar, ister swing tüccarı olun, bu gösterge grafikler arasında geçiş yapmadan daha yüksek zaman dilimi piyasa yönünü görselleştirmenize yardımcı olur.
Daha fazla ücretsiz gösterge için bizi desteklemek adına lütfen aşağıdaki bağlantıyı kullanarak brokerda kayıt olun
🇮🇷 توضیحات فارسی
مووینگ اوریج مولتی تایمفریم
اندیکاتور Multi Time Frame Moving Average یک ابزار حرفهای برای cTrader است که به شما امکان میدهد مووینگ اوریج هر تایمفریمی را مستقیماً روی چارت فعلی نمایش دهید.
برخلاف مووینگ اوریج پیشفرض سیتریدر، این اندیکاتور امکانات بیشتری برای شخصیسازی در اختیار شما قرار میدهد و برای معاملهگرانی که از تحلیل چند تایمفریمی استفاده میکنند بسیار کاربردی است.
امکانات
- نمایش مووینگ اوریج هر تایمفریم روی چارت فعلی
- پشتیبانی از انواع مووینگ اوریج:
-
- SMA
- EMA
- SMMA
- LWMA
- Wilder's Moving Average
- انتخاب نوع قیمت محاسبه:
-
- Close
- Open
- High
- Low
- Median Price
- Typical Price
- Weighted Price
- قابلیت تنظیم دوره (Period)
- امکان جابهجایی (Shift/Offset) مووینگ اوریج به جلو یا عقب
- تنظیم کامل رنگ، ضخامت و استایل خط
- محاسبات دقیق در حالت Multi Time Frame
- قابل استفاده روی تمام نمادها و تمام تایمفریمها
مناسب برای
این اندیکاتور برای معاملهگرانی مناسب است که:
- از تحلیل چند تایمفریمی استفاده میکنند.
- روند تایمفریمهای بالاتر را برای تأیید ورود بررسی میکنند.
- از مووینگ اوریج بهعنوان حمایت و مقاومت داینامیک استفاده میکنند.
- استراتژی معاملاتی آنها بر پایه Price Action و Moving Average است.
این ابزار به شما کمک میکند بدون نیاز به جابهجایی بین تایمفریمها، روند تایمفریمهای بالاتر را مستقیماً روی نمودار فعلی مشاهده کنید.