present
Kaydolun ve ilk alışverişinizde $50 indirim kazanın
Trading product for IR Close MTF Gösterge, image 1
IR Close MTF
5.0
Değerlendirmeler: 1
5.64K
Ücretsiz yüklemeler

Açıklama

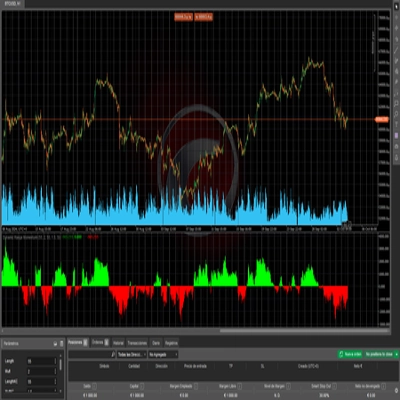
bu gösterge, daha düşük zaman diliminde başka bir zaman diliminin kapanışını gösterir. örn: günlük kapanışı m 15'te gösterir.


Özet

YZ özeti
IR Close MTF is a trading indicator designed to display the closing price of a higher time frame on a lower time frame chart. For example, it can show the daily close price while viewing a 15-minute chart. This functionality allows traders to easily reference key price levels from different time frames within a single chart, aiding in multi-time frame analysis. The indicator supports various time frame combinations, enhancing situational awareness without switching charts.
Gösterge profili

Tartışma

Müşteri değerlendirmeleri

5.0
Değerlendirmeler: 1
5
100 %
4
0 %
3
0 %
2
0 %
1
0 %
Müşteri değerlendirmeleri
September 30, 2025

SSS

cTrader Store üzerinden erişilebilen işlem botları, göstergeler ve eklentiler gibi ürünler, üçüncü taraf sağlayıcılar tarafından sağlanır ve yalnızca bilgilendirme ve teknik erişim amaçlarıyla sunulur. cTrader Store bir broker değildir ve yatırım tavsiyesi, kişisel öneriler vermez veya gelecekteki performansı garanti etmez.

Bu oluşturanın diğer ürünleri

"IR Candle MTF" logosu
4.6
(6)
Ücretsiz
with this indicator you could see other time frame candle in your chart.
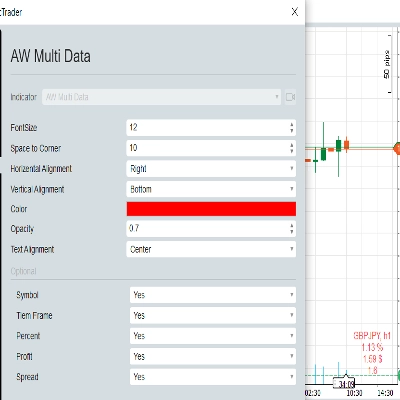
show spread on chart
some user add moving average to macd to see better. in ctrader 4.3.11 there is a problem with this . I make a macd tha
this indicator show macd on chart.
Multi Time Frame Moving Average is a powerful and flexible indicator for cTrader
 this moving include everything that a trader needs from Moving Average.
this indicaotr show distance between Tenkan to Kijun, Close to Kijun and Close to Tenkan 
Add Slowing to IR Moving Average.
IR Candle Open plots customizable opening price lines for daily, weekly, and monthly candles
Coral indicator
you could put your check list in your chart you could split your test with “,” you could put your checklist in indicat
don't move to the end of chart after timeframe changing. it should be better to use for near history. for long history

Şunları da beğenebilirsiniz

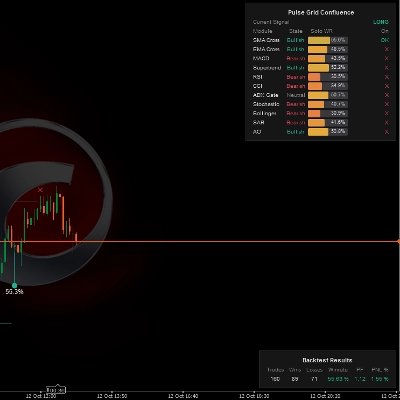
Multi-indicator confluence HUD & real-time backtest engine to detect trend alignment and filter high-probability setups.
🚀 HAI QUANTUM v4.0 | The Ultimate Quantum Terminal for cTrader (Smart Money & Algorithmic Trading)
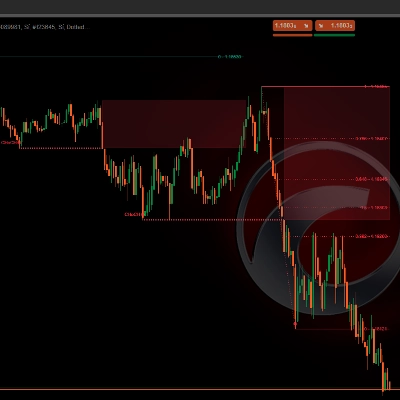
Map market structure, order blocks, liquidity and key zones with an interactive cTrader dashboard.
Universal multi time frame 'Moving Average' indicator with extended features
Candle quality meter with HTF context, patterns, and CLEAN / CAUTION / AVOID status.
RSI on the main chart with 45/55 momentum levels, overbought/oversold levels, averaged RSI, and multi-timeframe support.
Detects CHoCH breakouts, draws interest zones & auto Fibo. Built for Smart Money & Price Action Engulfing confirmation
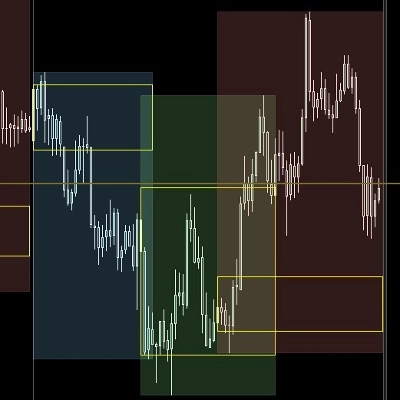
Session boxes with UTC offset, OR logic, adjustable opacity, and multi-day lookback.
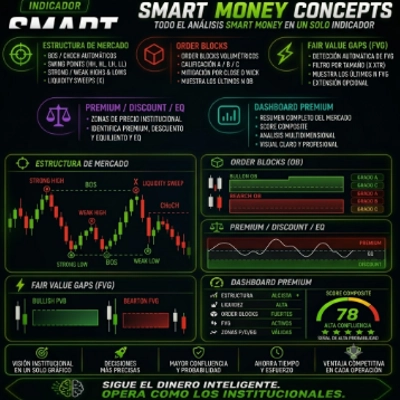
Smart Money Concepts Automate your institutional analysis and make decisions with pinpoint precision..
VWAP Bands indicator with 3 standard deviation levels, buy/sell zones, and a draggable ON/OFF button to toggle the entir
GOLD SENTINEL v1.0 - A CANDLE-COLORING INDICATOR FOR GOLD.
Tape Reading indicator ,book and flow analysis
Dark Poll Signal Indicator.liquidity leakage,precedes the great movement, accumulation, distribution
Volume profiler applying Wyckoff effort vs result and spread analysis with visual bar graphs.
Free chart-overlay indicator for confirmed BOS, CHoCH and ATR-filtered Fair Value Gap analysis.
All-In-One solution for ICT's FVG IFVG ORDERBLOCK in advanced mode.
IBS Indicator – Measures price position within bars for smarter trades. Works on all markets & timeframes.
This histogram helps visualize the strength and direction of market movements, making it easier to spot potential trends

Fiyat

5.64K
Ücretsiz yüklemeler