설명
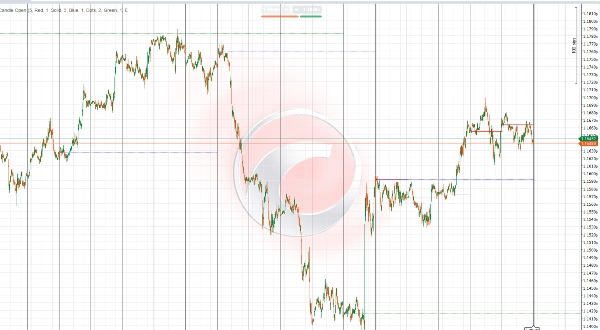
IR Candle Open Indicator는 주간, 일간 및 월간 캔들의 시가를 거래 차트에 표시하는 다목적 맞춤형 도구입니다. 트레이더는 표시할 기간(일, 주, 월) 수를 선택할 수 있어 전략에 맞는 유연한 다중 타임프레임 분석이 가능합니다.
주요 기능은 다음과 같습니다:
- 사용자가 정의한 일간, 주간 및 월간 기간 수에 대한 캔들 시가의 정확한 표시.
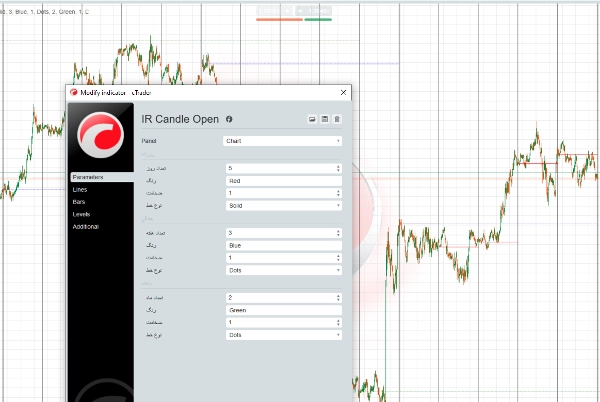
- 사용자 지정 가능한 선 스타일: 사용자는 차트 가독성을 높이기 위해 선 유형(실선, 점선, 점선), 색상 및 두께를 선택할 수 있습니다.
- 다중 타임프레임 시각화를 지원하여 다양한 시간대의 중요한 가격 수준을 식별하는 데 도움을 줍니다.
- 이 중요한 시가를 기반으로 잠재적 지지 및 저항 구역을 식별하는 데 도움을 줍니다.
- 외환, 원자재, 지수 및 암호화폐 등 다양한 시장과 호환됩니다.
이 유연성 덕분에 트레이더는 지표 표시를 개인 취향과 거래 스타일에 맞게 조정할 수 있어 명확성을 높이고 중요한 가격 수준에 기반한 의사 결정을 개선할 수 있습니다.
توضیح فارسی (بهروز شده)
اندیکاتور IR Candle Open ابزاری منعطف و قابل تنظیم است که قیمتهای باز شدن کندلهای هفتگی، روزانه و ماهیانه را روی نمودار معاملاتی شما نمایش میدهد. کاربران میتوانند تعداد دورههای روزانه، هفتگی و ماهیانه که میخواهند خطوط آنها نمایش داده شود را انتخاب کنند تا تحلیل چندتایمفریمی متناسب با سبک معاملاتی خود داشته باشند.
ویژگیهای کلیدی:
- نمایش دقیق خطوط قیمت باز شدن کندلها برای تعداد دورههای دلخواه در تایمفریمهای روزانه، هفتگی و ماهیانه.
- امکان انتخاب نوع خط (ساده، خطچین، نقطهچین)، رنگ و ضخامت خطوط برای بهبود وضوح و خوانایی نمودار.
- پشتیبانی از تحلیل چندتایمفریمی جهت شناسایی سطوح مهم قیمتی در بازههای زمانی مختلف.
- کمک به تشخیص سطوح حمایت و مقاومت احتمالی بر اساس این نقاط کلیدی باز شدن قیمتها.
- مناسب برای استفاده در بازارهای مختلف مانند فارکس، کالاها، شاخصها و رمزارزها.
این قابلیتها به تریدرها امکان میدهد تا نمایش اندیکاتور را بر اساس سلیقه و سبک معاملاتی خود تنظیم کنند و با وضوح بیشتر، تصمیمات بهتری بگیرند.
요약
고객 리뷰
5 | 100 % | |
4 | 0 % | |
3 | 0 % | |
2 | 0 % | |
1 | 0 % |


!["[Hamster-Coder] Bollinger Bands" 로고](https://cdn.ctrader.com/image/webp/21d8e5d6-fb11-4bac-b9ee-cd05c2b76804_30327)
!["High-Low Divergence [Iridio Capital]" 로고](https://cdn.ctrader.com/image/webp/443c4661-7abb-40f1-842f-4b6ec560649b_40914)