present
Sign up and get $50 off your first purchase
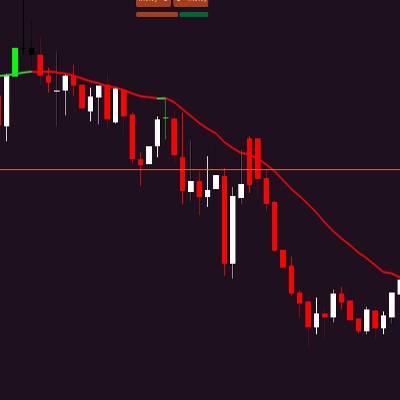
Trading product for IR Moving Average Indicator, image 1
IR Moving Average
5.0
Reviews: 1
5.67K
Free installs

Description

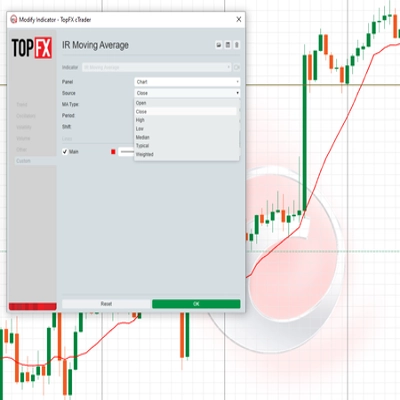
this moving include everything that a trader needs from Moving Average.

PriceType: Open,Close,High,Low, Median,Typical,Weighted

Support all moving average type.

Summary

AI summary
IR Moving Average is a comprehensive moving average indicator designed to meet traders' needs. It supports all types of moving averages and allows calculation based on various price types, including Open, Close, High, Low, Median, Typical, and Weighted prices. This flexibility enables users to tailor the indicator to different trading strategies and market conditions.
Indicator profile

Discussion

Customer reviews

5.0
Reviews: 1
5
100 %
4
0 %
3
0 %
2
0 %
1
0 %
Customer reviews
August 12, 2025
Pros: Flexible moving average with multiple calculation methods, lightweight, stable on all timeframes. Cons: No alerts, no MTF mode, no preset saving.

FAQ

Products available through cTrader Store, including trading bots, indicators and plugins, are provided by third-party developers and made available for informational and technical access purposes only. cTrader Store is not a broker and does not provide investment advice, personal recommendations or any guarantee of future performance.
More from this author

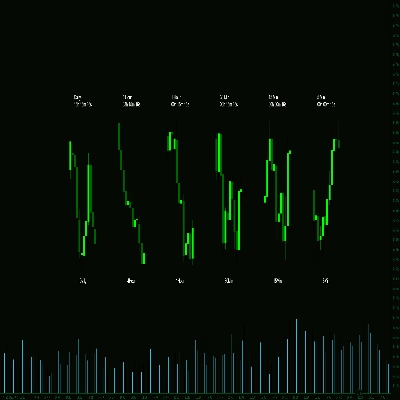
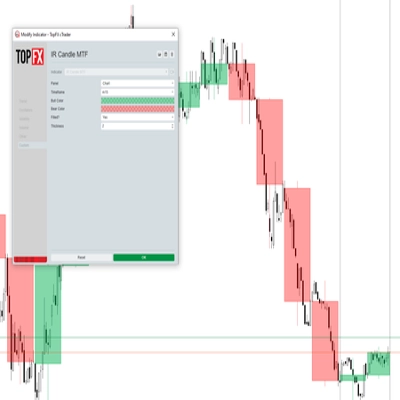
with this indicator you could see other time frame candle in your chart.
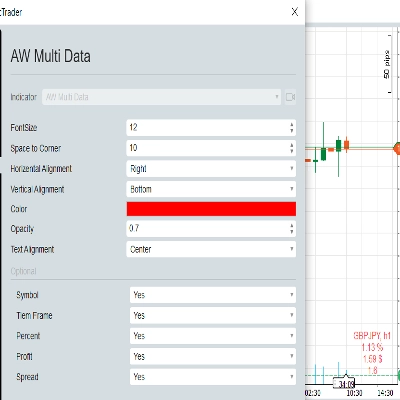
show spread on chart
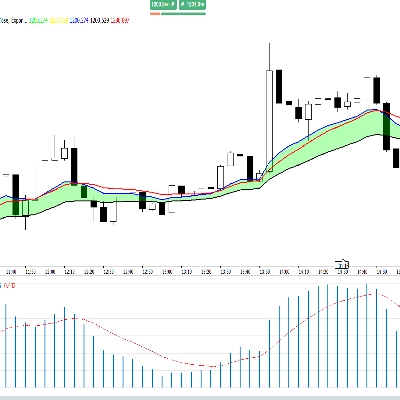
some user add moving average to macd to see better. in ctrader 4.3.11 there is a problem with this . I make a macd tha
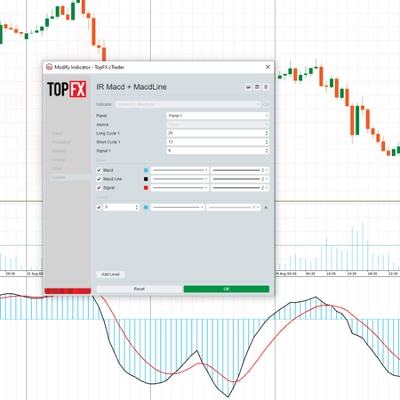
this indicator show macd on chart.
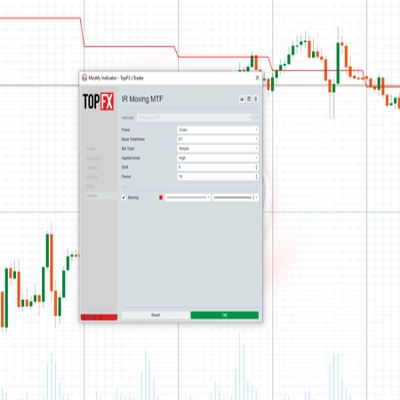
Multi Time Frame Moving Average is a powerful and flexible indicator for cTrader
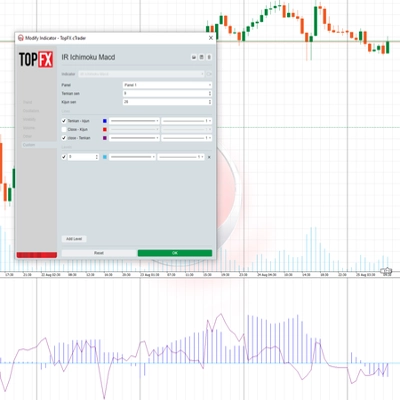
this indicaotr show distance between Tenkan to Kijun, Close to Kijun and Close to Tenkan 
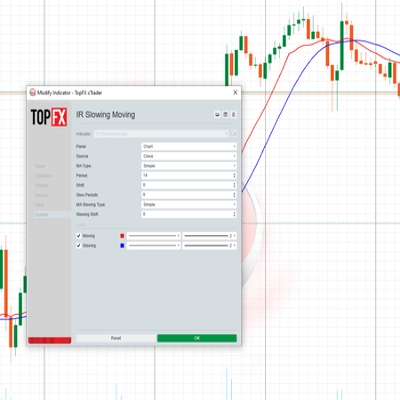
Add Slowing to IR Moving Average.
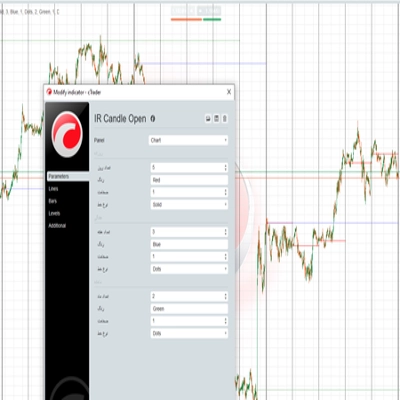
IR Candle Open plots customizable opening price lines for daily, weekly, and monthly candles
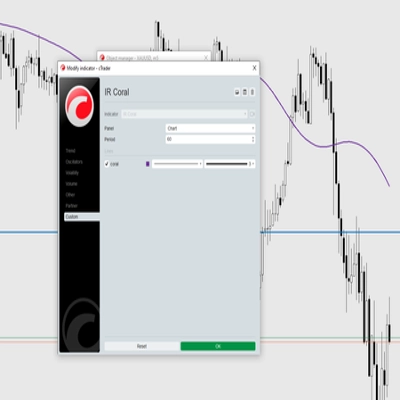
Coral indicator
you could put your check list in your chart you could split your test with “,” you could put your checklist in indicat
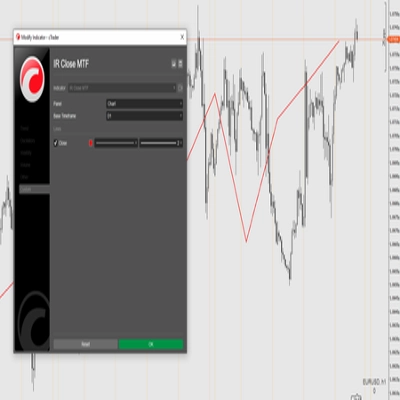
this indicator show other time frame close in lower time frame. for ex: show daily close in m 15.
don't move to the end of chart after timeframe changing. it should be better to use for near history. for long history

You may also like

The Multi-Timeframe Candle Indicator displays candles from multiple timeframes in one window, enhancing market analysis!
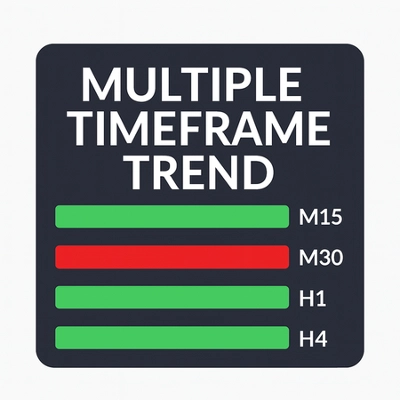
A compact, visual multi-timeframe trend indicator for cTrader. Easily spot bullish or bearish trends across 4 customizab
Liquidity Profiler Tools
🚀 Specialized algorithm is designed to confirm entry and exit points with precision 🎯
Volume Profile plots traded volume at each price level, highlighting high activity zones of precise support & resistance
Explore Elliott wave counts, three swing sizes and example levels with an interactive cTrader chart panel.
EMA MTF TREND PRO - Multi-timeframe trend analysis overlay indicator, 6 timeframes - in one table with ADX
Add your provider's gamma levels by hand or automatically with our feed plugin, and see the gamma regime at a glance.
Configure, simulate, and analyze trading strategies with custom filters, multi-target exits, and detailed performance me
Precision Sniper by PrimeQuant: Advanced confluence engine with auto-presets, dynamic TP/SL, and live backtest stats.
Advanced market structure and institutional cycle mapper with visual reference cards and entry alerts
Map market structure, order blocks, liquidity and key zones with an interactive cTrader dashboard.
Automatic Elliott Wave Detection with Professional Filters
Boost your trading with Candlestick Patterns for cTrader – auto-detect key signals for smarter, faster decisions!
Entry Momentum MACD Power Guide
setup tabajara
🎯Smart Signals : Auto Buy/Sell alerts with dynamic TP/SL algorithm. 💡
Trading.FC$_vwap Algo shows VWAP trends, dynamic support/resistance and deviation bands to spot potential trade entries.

Price

5.67K
Free installs