설명
Pinescriptlabs 스토어 지표: Pinescriptlabs 스토어 cBots : (cBot) Gold & BTC BreakoutSession Pivots(new)
PRICE ACTION (New)
Trailing Smart Algorithm (new)
Prediction Based on Linreg & ATR
SmartTrend Support &
Resistance
Lines
Dynamic
Market Structure
Analysis
of
Turning
Points
Fibonacci
Linear
Regression
Multi-timeframe
Multi-Level
Candle Bias
Tracker
Auto
Support and
Resistance
Trend
Lines
All
Support and
Resistance
Levels
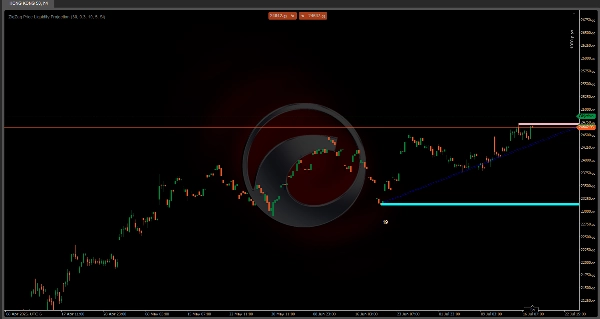
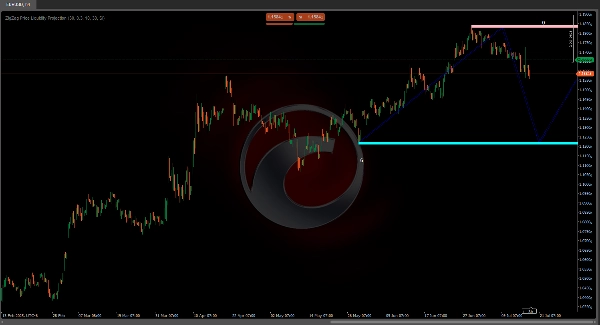
📊 ZigZag 가격 유동성 예측 지표
"시장이 움직이기 전에 어디서 반전할지 확인하세요!" 🔮
이 지표는 주요 지지/저항 레벨 🛑 과 유동성 구역을 예측합니다 💧 차트에서 다음을 사용하여:
- 🔍 피벗 포인트: 중요한 고점과 저점을 감지합니다
- 📈 ATR 변동성: 정밀 조정을 위한 가격 변동 측정
- 💦 유동성 예측: 지그재그 패턴을 통해 높은 활동 영역(매수/매도 클러스터)을 예상합니다
🎯 목적: 진입/청산 결정을 개선하기 위해 가격 반응 구역(반등/돌파/횡보)을 예측합니다
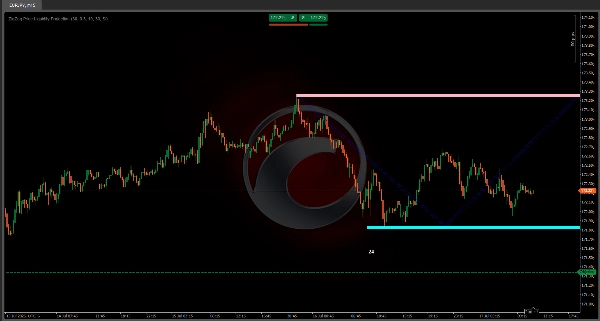
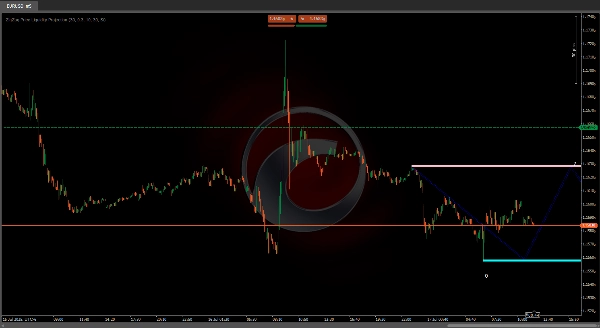
✨ 지그재그의 장점
이 연결된 선들은 보물지도 🗺️ 와 같아 다음을 보여줍니다:
1️⃣ 정의된 범위 내의 미래 가격 경로
2️⃣ 가격이 멈추거나 반전할 수 있는 잠재적 반전 구역
3️⃣ 거래 계획을 위한 시각적 참조 지점
🚦 주요 기능:
- 📅 중요한 레벨에 대한 조기 경고 시스템
- 🎯 피벗 구조(강세/약세 경로)를 기반으로 미래 움직임 예측
- 🔢 터치 카운터 (예: "24" = 해당 레벨에서 24번의 과거 테스트)
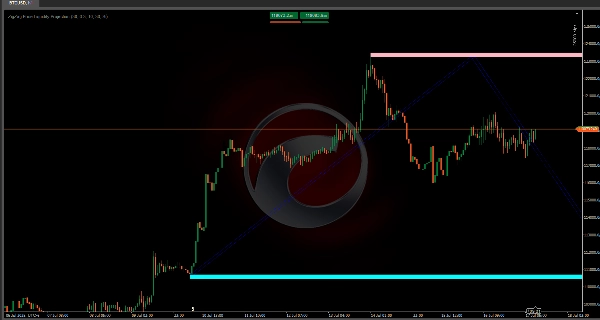
⚙️ 권장 설정
설정값효과
ATR 기간
30
🎚️ 변동성 민감도
피벗 기간
30
🔍 피벗 중요 범위
⏳ 최적 타임프레임: 15분 - 4시간 차트 ⏱️
💡 전문가 팁:
"확인을 위해 캔들스틱 패턴 🕯️ 과 결합하세요! 지그재그는 가격이 어디로 갈지 보여주고, 캔들은 언제 일어나는지 보여줍니다."
🎯 최종 요약:
강력한 올인원 시각 도구 로 다음을 포착합니다:
✅ 유동성 구역 💦
✅ 중요한 레벨 🎯
✅ 미래 가격 경로 🚀
움직임을 쫓기보다는 예측하고자 하는 당일 거래자에게 완벽한 도구입니다! 🏃💨