Описание
Профиль ликвидности и поглощения китов
Отслеживайте институциональные деньги, анализируйте поток ордеров и выявляйте зоны разворота с объемной точностью
Профиль ликвидности и поглощения китов — это не традиционный объемный профиль. Это набор инструментов анализа микроструктуры рынка, который разбирает каждую сделку, показывая вам не только где был торгован объем, но и кто его торговал (институциональные против розничных) и как цена взаимодействовала на этих уровнях (агрессия против поглощения).
Он оснащен оптимизированным движком рендеринга, который проецирует все данные справа от текущей цены, сохраняя ваш график полностью чистым и без задержек.
Ключевые особенности
- Фильтр силы (только киты): Использует алгоритм процентилей (например, топ 97%) для отделения институционального («Сильного») объема от розничного («Слабого»). Вы можете переключить режим «Только сильные», чтобы отслеживать исключительно след умных денег.
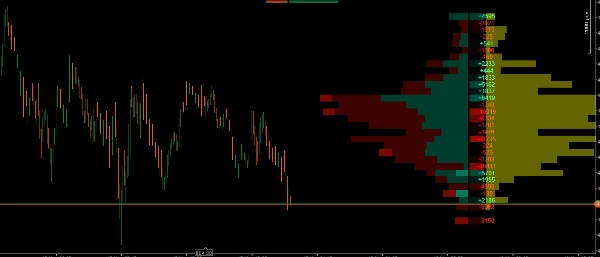
- Сложенный объемный профиль: Визуально отображает распределение бычьего и медвежьего объема по уровням цены, облегчая идентификацию точки контроля (POC) и узлов высокого/низкого объема (HVN/LVN).
- Автоматическое определение зоны стоимости: Выделяет уровни цены, на которых был торгован наибольший процент объема (по умолчанию 70%), затемняя внешние зоны для легкого восприятия контекста рынка с первого взгляда.
- Дельта-профиль (тепловая карта): Вычисляет точную разницу между рыночными покупками и продажами на каждом уровне цены. Включает числовые значения и визуальную тепловую карту для быстрого определения, кто агрессивно контролирует рынок.
- Профиль поглощения (желтые зоны): Измеряет объем, застрявший именно в тенях свечей. Это позволяет графически видеть, где умные деньги пассивно поглощают ликвидность от застрявших розничных трейдеров.
- Оптимизированная производительность: Тяжелые объемные вычисления обрабатываются только на последней свече, обеспечивая плавную и эффективную работу платформы cTrader даже на низких таймфреймах.
Как использовать этот индикатор в вашей торговле?
Этот индикатор предоставляет 3 уровня подтверждения для ваших сделок. Вот как эффективно их комбинировать:
1. Определите контекст с помощью объемного профиля и зоны стоимости
- Используйте объемный профиль, чтобы определить, где наибольшее принятие цены (зона стоимости и POC).
- Стратегия: Ищите возможности для покупки в нижней части зоны стоимости (поддержка) и для продажи в верхней части зоны стоимости (сопротивление).
2. Оцените агрессию с помощью дельта-профиля
- Когда цена достигает вашего ключевого уровня (например, зоны поддержки), смотрите на колонку Дельта.
- Стратегия: Если вы ищете покупку на поддержке, вы хотите видеть сильно положительную (зеленую) дельту на этом уровне, что указывает на агрессивное вмешательство покупателей. Если дельта остается сильно отрицательной, продавцы все еще доминируют.
3. Найдите идеальный триггер с помощью профиля поглощения (ядро индикатора)
- Здесь инструмент действительно проявляет себя. Часто рынок кажется резко падающим (сильная отрицательная дельта), но цена перестает падать. Почему? Потому что «киты» используют лимитные ордера, чтобы поглощать все это давление продаж.
- Стратегия (сделка на разворот): Если вы видите, что цена падает к критическому уровню и дельта отрицательна (застрявшие розничные продавцы), но внезапно появляется большой желтый бар в профиле поглощения, это значит, что институциональные игроки только что поглотили всю ликвидность в этой тени. Это ваш оптимальный триггер для входа в противоположном направлении!
4. Используйте «Фильтр силы», чтобы отсеять шум
- Если рынок консолидируется и направление неясно, включите опцию «Только сильные». Это скроет весь нерелевантный розничный шум и покажет вам точно, где крупные фонды накапливают или распределяют свои позиции.
Сводка
A Delta Profile heatmap calculates the net difference between market buys and sells at each price level, showing buyer or seller aggression. The Absorption Profile identifies volume trapped in candlestick wicks, revealing where institutional traders absorb liquidity from retail participants. The indicator’s optimized engine processes heavy volumetric calculations only on the latest candle, ensuring smooth performance on the cTrader platform.
Traders can use this tool to define market context, evaluate buying or selling aggression, and pinpoint reversal triggers based on absorption patterns. The "Strong Only" mode filters out retail noise during consolidation phases, focusing on institutional accumulation or distribution zones. This indicator supports volume and DOM data visualization to enhance decision-making around key support and resistance levels.
Отзывы покупателей
5 | 100 % | |
4 | 0 % | |
3 | 0 % | |
2 | 0 % | |
1 | 0 % |