
Описание
Набор инструментов поддержки и сопротивления — это комплексный индикатор анализа структуры рынка, предназначенный для помощи трейдерам в выявлении зон поддержки и сопротивления с высокой вероятностью на графиках. Объединяя несколько продвинутых алгоритмов обнаружения pivot-точек с адаптивными зонами волатильности, фильтрами институционального денежного потока и анализом ликвидности, этот набор инструментов превращает традиционные линии поддержки и сопротивления в стратегический инструмент, основанный на данных.
Обнаружение
Этот набор инструментов включает четыре продвинутых методологии обнаружения, разработанных для различных стилей торговли и рыночных условий:
- Pivot-точки: Классический подход к обнаружению поддержки и сопротивления с использованием настраиваемой силы обратного просмотра слева и справа для выявления локальных максимумов и минимумов.
- Дончиан: Высокопроизводительный алгоритм с конечным автоматом, который обнаруживает чередующиеся структуры колебаний. Вместо фиксированной задержки он подтверждает экстремумы при смене направления рынка.
- CSID: Метод обнаружения, основанный на импульсе, который выявляет структурные поворотные точки на основе последовательных бычьих или медвежьих свечей, выделяя сильные зоны начала тренда.
- ZigZag: Алгоритм, основанный на волатильности, который фильтрует незначительные колебания цены, требуя минимального процентного отклонения перед идентификацией колебания.
Зона / Уровень
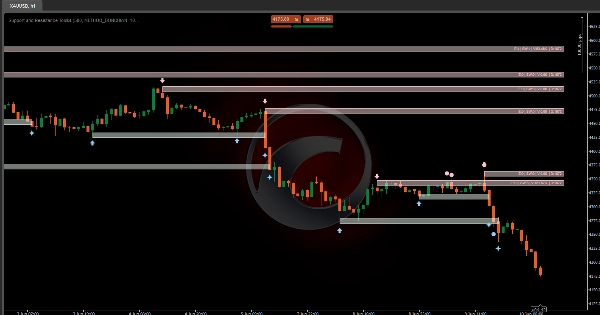
В отличие от обычных индикаторов, которые просто рисуют фиксированные линии, этот инструмент рассматривает уровни поддержки и сопротивления как динамические ценовые зоны, основанные на следующих характеристиках:
- Глубина зоны (множитель ATR): Определяет толщину каждой зоны на основе среднего истинного диапазона. Это позволяет зонам автоматически масштабироваться в зависимости от волатильности рынка.
- Буфер пробоя (множитель ATR): Уникальный защитный буфер, который расширяет зону за пределы стороны пробоя. Цена должна выйти за этот дополнительный слой волатильности, прежде чем индикатор подтвердит пробой, снижая количество ложных сигналов и фейковых пробоев.
Фильтрация и видимость:
- Объединение пересекающихся: Объединяет пересекающиеся зоны в большую «Суперзону», которая представляет полный исторический диапазон взаимодействия.
- Скрывать самые старые первыми: Приоритетно отображает недавнюю структуру рынка, скрывая более старые зоны при пересечении.
- Скрывать самые молодые первыми: Сохраняет устоявшиеся исторические структуры, игнорируя меньшие новые зоны, появляющиеся внутри существующих диапазонов.
Фильтрация уровней (E: Входы | S: Сила | SW: Свипы | V: Объем | D: Продолжительность)
- Входы по цене (E): Требует, чтобы уровень был повторно протестирован указанное количество раз перед появлением на графике.
- Свипы (SW): Обнаруживает ловушки ликвидности, когда цена кратковременно пробивает уровень с фитилем, но закрывается обратно внутри зоны.
- Торгуемый объем (V): Отслеживает общий объем торгов, происходящих во время взаимодействия цены с зоной, выделяя участие институциональных игроков.
- Продолжительность (D): Требует, чтобы зоны существовали минимум определенное количество баров, прежде чем считаться действительными структурными уровнями.
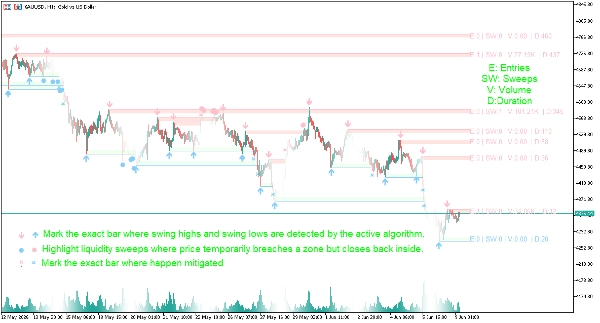
Визуальные сигналы
- ⬆/⬇ Стрелки: Отмечают точный бар, где активным алгоритмом обнаружены максимумы и минимумы колебаний.
- ● Большие точки: Выделяют свипы ликвидности, когда цена временно пробивает зону, но закрывается обратно внутри.
- ✖ Крест: Отмечают точный бар, где максимумы и минимумы колебаний были перемещены.
- Итоговые метки: Каждая область отображения содержит краткую метку данных с параметрами E (Входы), S (Сила), SW (Свипы), V (Объем) и D (Продолжительность), позволяя пользователям быстро оценить качество структуры.
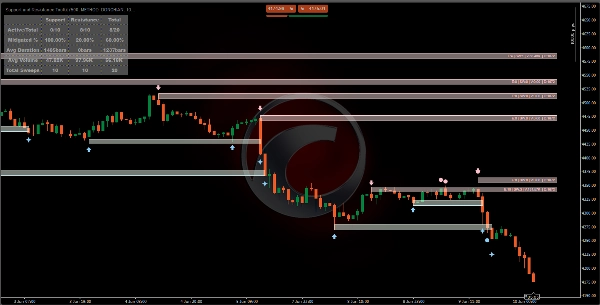
Панель управления
- Активные / Всего: Показывает, сколько структур в настоящее время активно по сравнению с общим количеством, обнаруженным исторически.
- Процент смягчения: Измеряет, как часто уровни пробиваются или смягчаются, предоставляя информацию о надежности структуры рынка.
- Средняя продолжительность: Среднее количество баров, в течение которых зона поддержки или сопротивления сохраняется до пробоя.
- Средний объем: Показывает среднее участие институциональных игроков в зонах до пробоя.
- Общее количество свипов: Отслеживает поведение охоты за ликвидностью на рынке.
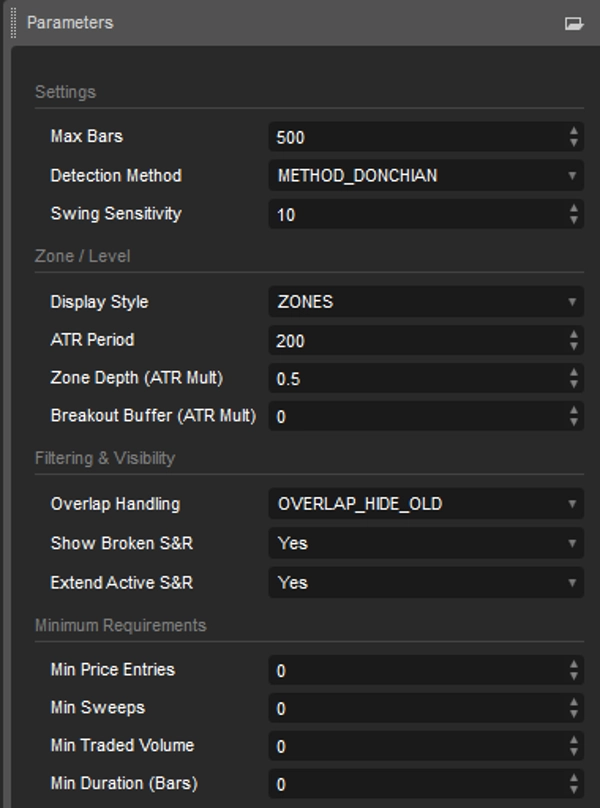
Настройки индикатора
Настройки обнаружения
- Метод обнаружения: Выберите между логикой обнаружения колебаний Pivot, Donchian, CSID или ZigZag.
- Чувствительность колебаний: Регулирует необходимое отклонение или длину обратного просмотра для подтверждения максимумов и минимумов колебаний.
Конфигурация зон и уровней
- Стиль отображения: Переключение между точными горизонтальными линиями поддержки и сопротивления или зонами на основе ATR.
- Период ATR: Определяет период волатильности, используемый для расчетов зон.
- Глубина зоны (множитель ATR): Регулирует толщину зон поддержки и сопротивления.
- Буфер пробоя (множитель ATR): Добавляет буфер волатильности для фильтрации ложных пробоев.
Видимость графика и контроль структуры
- Обработка перекрытий: Выберите способ обработки пересекающихся зон (Объединение, Скрыть самые старые или Скрыть самые молодые).
- Максимум активных (несмягченных): Ограничивает количество активных зон поддержки и сопротивления, отображаемых на графике.
- Показать пробитые S&R: Переключает видимость пробитых уровней для исторического анализа.
- Продлить активные S&R: Проецирует активные уровни на будущие бары цены.
Минимальные структурные требования
- Минимум входов по цене: Устанавливает необходимое количество повторных тестов, прежде чем уровень станет видимым.
- Минимум свипов: Требует определенное количество свипов ликвидности перед отображением зоны.
- Минимальный торгуемый объем: Обеспечивает соответствие зон минимальному порогу участия институциональных игроков.
- Минимальная продолжительность (бары): Требует, чтобы уровни существовали определенное количество баров перед появлением.
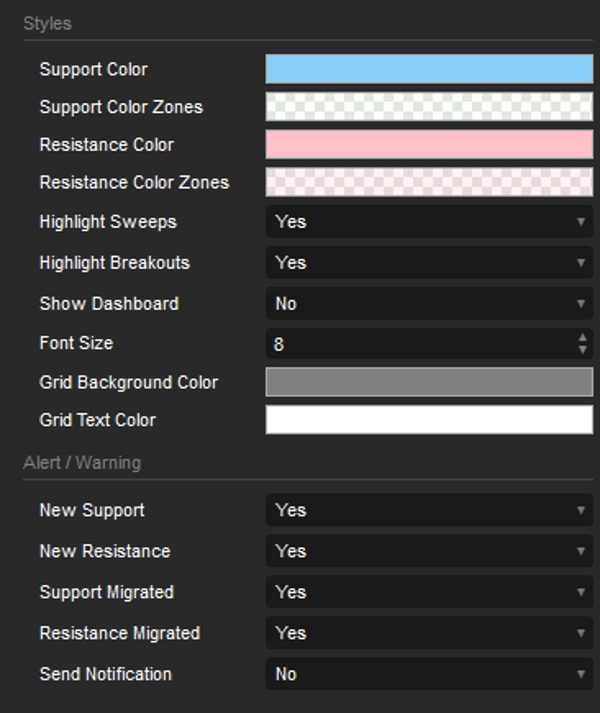
Стили и оповещения
- Стили: Настройка цвета объектов. Скрыть/Показать панель управления.
- Оповещения: Включение/выключение оповещений при обнаружении нового уровня поддержки и сопротивления или при перемещении уровня.
Сводка
Unlike traditional fixed lines, this tool defines support and resistance as dynamic price zones, with thickness and breakout buffers scaled by Average True Range (ATR) to adapt to market volatility. It features zone merging and selective visibility options to manage overlapping zones, prioritizing recent or historical structures as needed.
The indicator applies multiple filters based on price re-tests, liquidity sweeps, traded volume, and zone duration to validate structural levels. Visual signals include arrows marking swing points, dots highlighting liquidity sweeps, crosses for migrated swings, and summary labels displaying entries, strength, sweeps, volume, and duration metrics.
A dashboard provides real-time statistics on active versus total structures, mitigation percentages, average zone duration, volume, and liquidity sweep counts. Users can customize detection methods, sensitivity, zone display styles, ATR parameters, overlap handling, and structural requirements. Alerts can be enabled for new or migrated support and resistance levels.
This toolkit supports detailed market structure analysis with data-driven, volatility-adjusted zones to assist traders in identifying key price areas.


