

OrderFlow Absorption Matrix
Indicateur
1 achats
Version 1.0, Jul 2026
Windows, Mac
Depuis le 23/06/2025
1
Ventes
Description
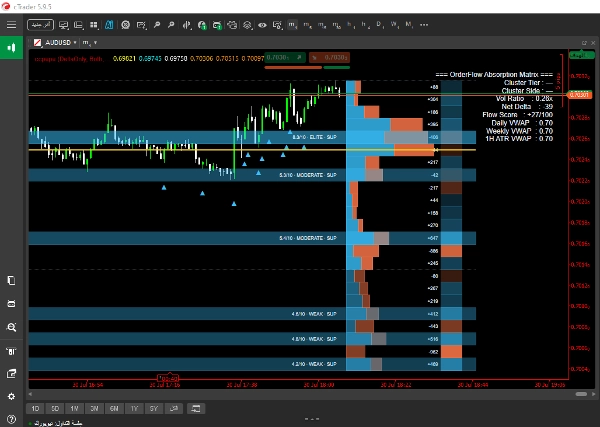
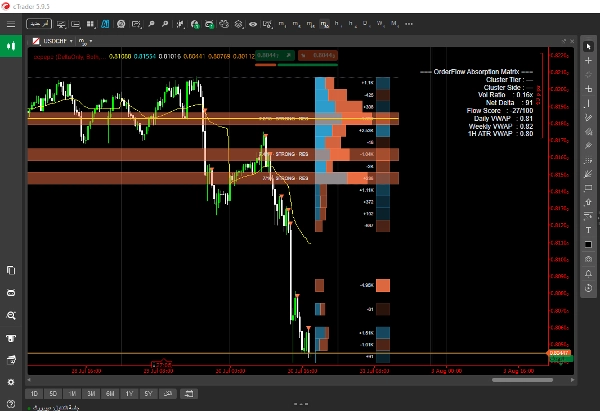
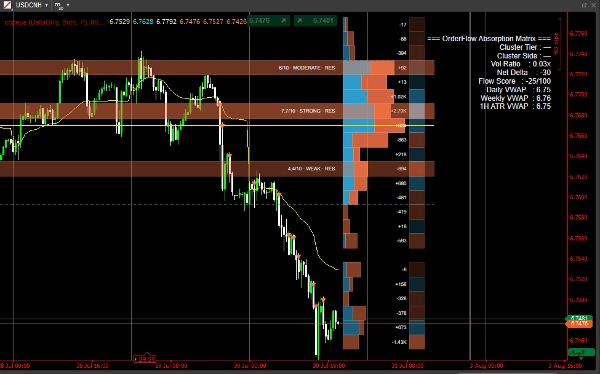
1️⃣ Flux d'ordres & Détection de Delta
- Analyse en période inférieure (LTF) : L'indicateur examine les données des chandeliers de période inférieure (par exemple, barres d'une minute) à l'intérieur de chaque barre actuelle pour calculer :
-
- Delta net : La différence nette entre le volume d'achat et de vente.
- Absorption : Volume important échangé aux extrémités de la barre qui ne parvient pas à pousser le prix plus loin, signalant de grandes ordres limites passifs absorbant la liquidité du marché.
- Détection d'empreintes de baleines : Utilise des percentiles dynamiques calculés sur trois fenêtres de retour distinctes (court, moyen, long) combinés avec un moteur de consensus personnalisable pour isoler les véritables pics de volume institutionnel.
2️⃣ Moteur de profil de volume adaptatif
- Segmentation des bacs : Segmente la plage de prix historique (Lookback Bars) en bacs de prix verticaux égaux.
- Distribution du volume : Sépare le volume d'achat, le volume de vente et le delta par bac, affichant des barres de profil horizontales proportionnelles sur le côté droit du graphique.
- Gestion dynamique des périodes : Au lieu de s'appuyer sur des ticks fixes en secondes, l'indicateur évalue dynamiquement les durées réelles des barres (
GetCurrentBarSpan). Cela évite l'effondrement du profil ou la distorsion des lignes sur des périodes non standard et lors des interruptions de session de marché (comme les écarts nocturnes du marché boursier). - Calcul de la zone de valeur & POC :
-
- POC (Point de Contrôle) : Identifie le niveau de prix avec le volume le plus élevé et le met en évidence avec une ligne d'ancrage proéminente.
- Zone de valeur (VA) : Isole dynamiquement le pourcentage central du volume (par exemple, 70%) et trace le Haut de la zone de valeur (VAH) et le Bas de la zone de valeur (VAL).
3️⃣ Système de notation de zone multi-facteurs pondéré
Chaque bac de prix est continuellement évalué à l'aide d'une formule multi-facteurs pondérée notée de 1 à 10 :
Score=w1⋅Volume+w2⋅Absorption+w3⋅Touches+w4⋅Rejets+w5⋅Récence
- Profilage automatique des zones : Les niveaux à score élevé (Élite ou Fort) sont projetés sur le graphique comme des zones dynamiques de support/résistance avec des badges numériques de force en temps réel.
4️⃣ Signaux VWAP ancrés & déclencheurs d'exécution
- Calcule les lignes de référence VWAP ancrées aux principaux changements temporels (début de journée, semaine et mois).
- Analyse croisée de l'action des prix par rapport aux VWAP ancrés ainsi qu'aux déclencheurs de cluster à fort volume pour tracer des flèches d'entrée précises directement sur le graphique.
5️⃣ Tableau de bord analytique à l'écran
Un HUD clair en temps réel positionné dans n'importe quel coin du graphique de votre choix fournit un résumé immédiat des conditions du marché :
- Niveau de cluster : Classification de la barre actuelle (Baleine, Moyen, Petit).
- Côté du cluster & Delta net : Biais directionnel de liquidité et chiffres précis du delta.
- Ratio de volume : Volume actuel par rapport aux moyennes mobiles.
- Score de flux : Un score normalisé de momentum/flux d'ordres allant de −100 à +100.
- Références VWAP : Valeurs en temps réel pour les niveaux VWAP actifs
Résumé
Résumé IA
OrderFlow Absorption Matrix is an advanced indicator for cTrader that provides detailed order flow and volume profiling to identify institutional trading activity. It analyzes lower timeframe candle data to calculate net delta (buy vs. sell volume) and absorption, highlighting heavy volume at bar extremes where price fails to move further, indicating large passive limit orders. The indicator detects significant volume spikes ("Whale Prints") using dynamic percentiles across multiple lookback windows combined with a consensus engine.
It features an adaptive volume profile engine that segments historical price ranges into equal bins, displaying buy volume, sell volume, and delta per bin with proportional horizontal bars. The profile dynamically adjusts for varying timeframes and market session breaks, calculating key levels such as Point of Control (highest volume price) and Value Area (core volume range).
A weighted multi-factor scoring system continuously evaluates price bins based on volume, absorption, touches, rejections, and recency, projecting high-scoring zones as dynamic support/resistance levels with numeric strength indicators. Anchored VWAP lines are calculated for key time anchors (day, week, month) and combined with volume cluster triggers to plot precise entry signals.
An on-screen analytics dashboard provides real-time summaries including cluster tier classification, directional delta, volume ratios, momentum scores, and VWAP benchmarks, aiding in market condition assessment and trade decision-making.
It features an adaptive volume profile engine that segments historical price ranges into equal bins, displaying buy volume, sell volume, and delta per bin with proportional horizontal bars. The profile dynamically adjusts for varying timeframes and market session breaks, calculating key levels such as Point of Control (highest volume price) and Value Area (core volume range).
A weighted multi-factor scoring system continuously evaluates price bins based on volume, absorption, touches, rejections, and recency, projecting high-scoring zones as dynamic support/resistance levels with numeric strength indicators. Anchored VWAP lines are calculated for key time anchors (day, week, month) and combined with volume cluster triggers to plot precise entry signals.
An on-screen analytics dashboard provides real-time summaries including cluster tier classification, directional delta, volume ratios, momentum scores, and VWAP benchmarks, aiding in market condition assessment and trade decision-making.
Profil de l'indicateur
Catégorie de l'indicateur
Statistiques
Type de résultat
Filtre
Exigences en matière de données
Données de tick
Signaux pris en charge
Dépassement de niveau
Atteinte du niveau
Inversion
Divergence
Discussion
Avis clients
0.0
Avis : 0
Avis clients
Il n'y a pas encore d'avis sur ce produit. Vous l'avez déjà essayé ? Soyez le premier à en parler aux autres !
Questions fréquentes
Bollinger Bands
Key Levels
Volume
Supply & Demand
VWAP
Support & Resistance
Les produits disponibles sur cTrader Store, notamment les bots de trading, les indicateurs et les plug-ins, sont fournis par des développeurs tiers et mis à disposition à titre informatif et à des fins d'accès technique uniquement. cTrader Store n'est pas un courtier et ne fournit aucun conseil en investissement, aucune recommandation personnelle ni aucune garantie quant aux performances futures.
Plus de cet auteur
















Prix
Depuis le 23/06/2025
1
Ventes