
Pivot Points Clasic,FIBO,etc
Индикатор
819 скачивания
Версия 1.0, Jul 2025
Windows, Mac
Описание
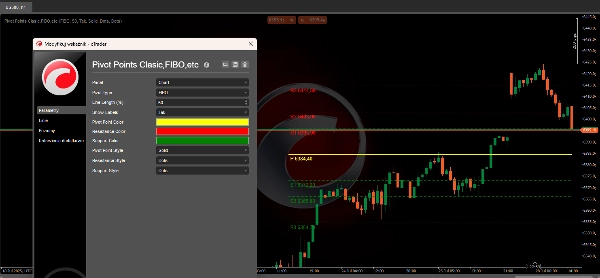
Настраиваемые Pivot Points — универсальный индикатор Pivot для cTrader
Откройте для себя мощь профессионального анализа ценового действия с одним универсальным инструментом!
Pivot Points Customizable — это продвинутый, очень гибкий индикатор для cTrader, который предоставляет все основные методы расчёта pivot — обеспечивая чёткие уровни поддержки/сопротивления, индивидуальное оформление и умные подписи на графике.
Основные характеристики:
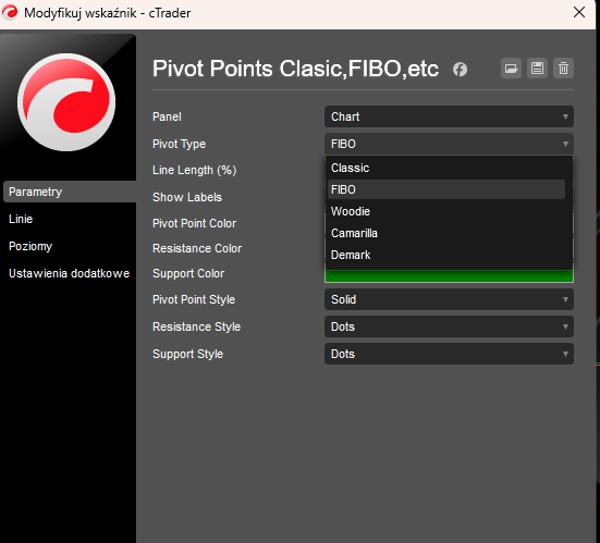
- 5 методов Pivot в одном:
Мгновенно переключайтесь между классическими, Фибоначчи, Вуди, Камарилья и Демарком. Идеально подходит для всех стилей торговли: скальпинг, дейтрейдинг и свинг-трейдинг. - Полная настройка:
-
- Выбирайте метод расчёта pivot.
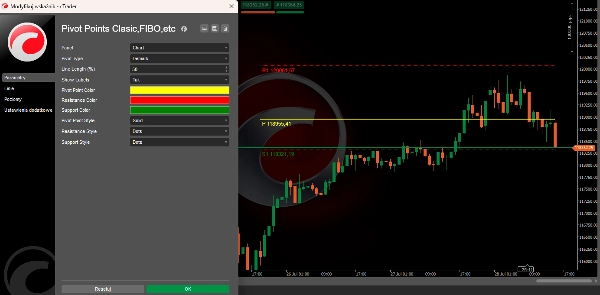
- Устанавливайте индивидуальные цвета и стили линий для уровней pivot, сопротивления и поддержки.
- Регулируйте видимую длину линии в процентах от вашего графика для чистого, не загромождённого отображения.
- Включайте и отключайте умные подписи, показывающие уровни цен в реальном времени для каждого pivot.
- Профессиональное наложение на график:
Отображает pivot и уровни поддержки/сопротивления прямо на вашем ценовом графике с автоматическим обновлением при появлении новых баров.
Поддерживаемые уровни для каждого метода: -
- Классический, Фибо, Вуди: До 3–4 уровней сопротивления (R1–R4) и поддержки (S1–S4)
- Камарилья: До 4 уровней сопротивления и поддержки
- Демарк: Уникальные пользовательские уровни (только R1, S1 и Pivot)
- Молниеносный и лёгкий:
Оптимизирован для работы в реальном времени — без задержек, без внешних библиотек, 100% нативный код cTrader. - Идеально для всех рынков:
Отлично работает с Forex, индексами, товарами, криптовалютами и другими!
Почему стоит выбрать Pivot Points Customizable?
- Несколько стратегий, один инструмент: Переключайте pivot одним кликом — тестируйте, что подходит вашему рынку!
- Выделяйте ключевые уровни с первого взгляда:
Мгновенный доступ к зонам, где вероятны развороты или прорывы цены. - Максимальная ясность графика:
Линии автоматически подстраиваются под окно графика — больше никаких загромождённых или перекрывающихся индикаторов. - Повышайте уверенность в торговле:
Знайте, где институциональные и профессиональные трейдеры следят за ценой каждую сессию.
Принимайте лучшие торговые решения уже сегодня. Попробуйте Pivot Points Customizable — и увидьте разницу в вашем техническом анализе!
Сводка
ИИ-сводка
Pivot Points Customizable is a versatile indicator designed for the cTrader platform that integrates five major pivot point calculation methods: Classic, Fibonacci, Woodie, Camarilla, and Demark. It provides traders with clear support and resistance levels directly overlaid on price charts, updating automatically as new bars form. Users can fully customize the indicator by selecting pivot calculation methods, adjusting colors and line styles for pivot, resistance, and support levels, and setting line lengths relative to the chart window to maintain visual clarity. Smart labels displaying real-time price levels for each pivot can be toggled on or off. The indicator supports multiple resistance and support levels depending on the method chosen—up to four for Classic, Fibonacci, Woodie, and Camarilla, and unique levels for Demark. Optimized for real-time performance with native cTrader code, it operates without lag or external dependencies. This tool is suitable for various trading styles including scalping, day trading, and swing trading, and is compatible with multiple markets such as Forex, indices, commodities, and cryptocurrencies. It aims to assist traders in identifying key price levels where reversals or breakouts are likely, enhancing technical analysis and decision-making.
Профиль индикатора
Отзывы покупателей
0.0
Отзывы: 0
Отзывы покупателей
У этого продукта еще нет отзывов. Уже попробовали его? Поделитесь впечатлениями!
Обсуждение
Частые вопросы
Продукты, доступные в cTrader Store, включая торговых ботов, индикаторы и плагины, предоставляются сторонними разработчиками и доступны исключительно в информационных и технических целях. cTrader Store не является брокером и не предоставляет инвестиционные консультации, персональные рекомендации или какие-либо гарантии будущей доходности.


Цена
С 26/06/2025
59.07M
Торгуемый объем
965.98K
Выигранные пипы
819
Бесплатные установки