
Описание
⚠️ Мы переехали на 👉 PrimeQuant
🚫🚫🚫 Не покупайте этот индикатор!
⚡ ДОСТУПНА ВЕРСИЯ НОВОГО ПОКОЛЕНИЯ: Этот классический инструмент LudwigICT был переработан, реструктурирован и выпущен заново под нашим новым брендом разработчика, PrimeQuant. Новая версия предлагает упрощённый интерфейс и обновлённые свойства для текущих рыночных условий. Получите обновлённую версию по сниженной цене здесь:
👉 Complete ICT SMC Suite - ADR AWR AMR OHLC Fibs EIS SR Alert
👉 Complete ICT SMC Suite - ADR AWR AMR OHLC Fibs EIS SR Alert
👉 Complete ICT SMC Suite - ADR AWR AMR OHLC Fibs EIS SR Alert
(Обратите внимание: листинг LudwigICT остаётся активным для пользователей старой версии, но больше не будет получать обновления или активные скидки.)
🔥 ПРОДВИНУТЫЙ НАБОР ICT + ADR + AWR PRO
Перестаньте гадать и начните видеть рынок с институциональной ясностью. ADVANCED ICT SUITE PRO от LudwigICT — это профессиональный универсальный набор инструментов для графиков, созданный для взыскательных трейдеров, работающих с ценовым действием. Тщательно разработанный как стабильная и визуально идеальная реплика легендарного индикатора Pine Script, этот набор автоматизирует сложную задачу построения критически важных рыночных структур, позволяя вам сосредоточиться на самом важном: вашей стратегии и исполнении.
Это не просто ещё один индикатор; это полноценная система для анализа рынка. Плавно интегрируя основные концепции ICT — Цена, Время, Волатильность и Моментум, этот набор предоставляет непревзойдённый институциональный взгляд на финансовые рынки прямо на вашем графике cTrader.
Почему стоит выбрать набор LudwigICT?
- Универсальная мощь: Этот один индикатор заменяет десятки отдельных инструментов. Вы получаете анализ Фибоначчи, проекции диапазонов, многоуровневую рыночную структуру, контекст старших таймфреймов и окраску моментума в одном лёгком и эффективном пакете.
- Непоколебимая стабильность — король: Вы когда-нибудь использовали индикатор, где уровни прыгают и перерисовываются при прокрутке? Мы решили эту проблему. Наша собственная логика Smart Anchoring гарантирует, что ваши уровни Фибоначчи закреплены за значимыми историческими поворотами, обеспечивая стабильную и надёжную основу, которая адаптируется только при реальных изменениях рыночной структуры.
- Визуальное совершенство и ясность: Мы считаем, что самый ценный актив трейдера — это его внимание. Этот набор создан для улучшения ясности, а не для создания хаоса. Элементы чистые, ненавязчивые и полностью настраиваемые. Настройки по умолчанию готовы к профессиональному использованию сразу после установки.
- Точная инженерия для серьёзных трейдеров: Каждый расчёт, от Elder Impulse System до Average Daily Range, тщательно протестирован и точно соответствует оригинальной логике Pine Script. Без сокращений и приближений.
Ключевые функции объяснены
Набор состоит из нескольких мощных, независимых модулей, которые вы можете включать и настраивать под свой стиль торговли.
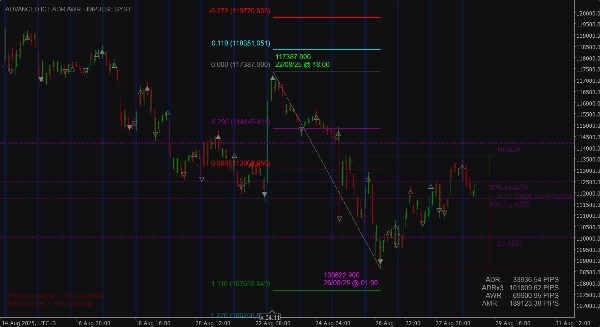
✔️ Стабильное и закреплённое построение уровней Фибоначчи (сердце набора)
Самый стабильный и интеллектуальный инструмент Фибоначчи, доступный на cTrader.
- Логика Smart Anchoring: Автоматически определяет и закрепляет последние крупные значимые максимумы и минимумы, обеспечивая стабильный и надёжный ценовой диапазон для вашего анализа.
- Интеллектуальный сброс при пробое: Уровни Фибоначчи остаются закреплёнными, пока цена не закроется решительно за пределами установленного диапазона (расстояние пробоя полностью настраивается). Это предотвращает скачки построения при незначительных откатах и гарантирует адаптацию только при реальном изменении структуры рынка.
- Фирменная пунктирная трендовая линия: Знаковая пунктирная диагональная линия соединяет точки закрепления вашего диапазона Фибоначчи, обеспечивая чёткое визуальное представление анализируемого тренда.
- Опциональный наложенный ZigZag: Для дополнительного подтверждения вы можете включить классический наложенный ZigZag, чтобы видеть путь всех исторических поворотных точек. По умолчанию отключён для сохранения чистоты графика.
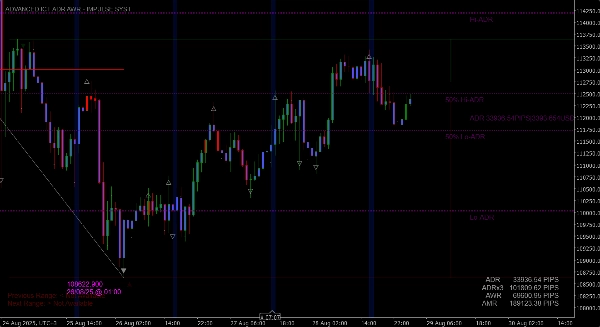
✔️ Elder Impulse System (окраска баров моментума)
Мгновенно оценивайте тройной консенсус рынка: тренд, моментум и силу.
- Зелёные бары: Обозначают бычий консенсус (13 EMA растёт и гистограмма MACD растёт). Рынок находится в сильном восходящем тренде.
- Красные бары: Обозначают медвежий консенсус (13 EMA падает и гистограмма MACD падает). Рынок находится в сильном нисходящем тренде.
- Синие бары: Обозначают нейтральное состояние или разногласия между трендом и моментумом. Время для осторожности.
- Границы баров: Тонкая, но важная функция. Вокруг каждого бара рисуется цветная граница, показывающая его истинное направление (бычье или медвежье закрытие), что необходимо для точного анализа свечей, когда основной цвет переопределён.
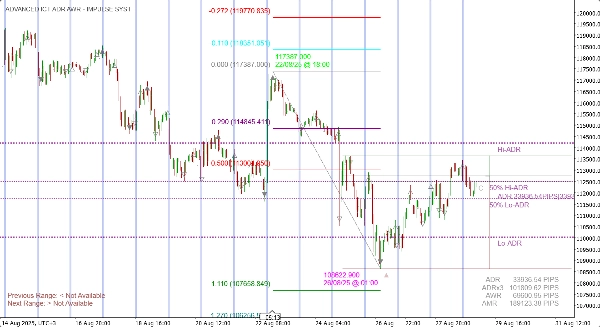
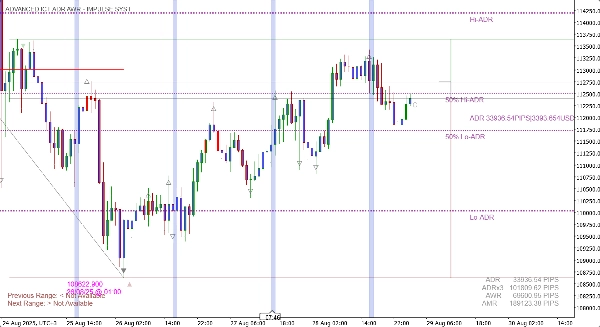
✔️ Продвинутые проекции диапазонов (ADR, AWR, AMR)
Знайте границы вашего инструмента и устанавливайте реалистичные дневные, недельные и месячные цели.
- Динамические проекции: Автоматически рассчитывает и отображает средний дневной, недельный и месячный диапазоны.
- Проецируемые максимумы и минимумы: Показывает проецируемые уровни поддержки и сопротивления на основе рассчитанных диапазонов.
- 50% средние точки: Ключевые для определения равновесия и потенциальных точек разворота внутри проецируемого диапазона.
- Таблица данных на экране: Чистая, настраиваемая таблица отображает все ключевые значения диапазонов в пипсах и/или валюте для быстрого обзора.
✔️ Многоуровневая рыночная структура (короткие, средние и долгие колебания)
Перестаньте рисовать точки колебаний вручную. Индикатор сделает это за вас.
- Автоматическое определение: Отображает короткие (ST), средние (IT) и долгие (LT) максимумы и минимумы прямо на вашем графике.
- Чёткие символы: Использует простую и интуитивно понятную систему точек и треугольников для отображения иерархии рыночной структуры.
✔️ Уровни OHLC старших таймфреймов
Торгуйте с контекстом нескольких таймфреймов, не покидая график.
- Ключевые ценовые уровни: Наложение открытия, максимума, минимума и закрытия любого старшего таймфрейма (например, недельного, дневного) в виде чистых линий или затенённых блоков.
- Анализ сессий: Мгновенно видьте, где текущая цена относительно ключевых уровней предыдущего дня или недели.
✔️ Динамические инструменты поддержки и сопротивления
- Уровни поддержки/сопротивления Ганна: Мощный набор линий поддержки и сопротивления, математически выведенных и адаптирующихся к волатильности инструмента.
- Digital Root Time: Выделяет определённые, заранее заданные временные окна с помощью вертикальных полос полной высоты, которые динамически изменяются при панорамировании и масштабировании, обеспечивая постоянную видимость.
Как использовать ADVANCED ICT SUITE PRO
Этот набор — универсальный инструмент, а не простой индикатор сигналов "покупать/продавать". Вот несколько способов интегрировать его в вашу торговлю:
- Торговля с высокой вероятностью совпадения:
-
- Дождитесь отката цены к ключевому уровню Фибоначчи (например, 0.618 или 0.786) в стабильном, закреплённом тренде.
- Ищите совпадения: совпадает ли этот уровень Фибоначчи с уровнем OHLC старшего таймфрейма или с линией поддержки/сопротивления Ганна?
- Используйте Elder Impulse System для сигнала входа. Дождитесь смены окраски бара в вашу пользу (например, с синего/красного на зелёный для длинной позиции) перед выполнением сделки.
- Установите цели прибыли на следующем уровне расширения Фибоначчи или на проецируемом максимуме/минимуме ADR/AWR.
- Подтверждение тренда и входы по моментуму:
-
- Определите общий тренд с помощью рыночной структуры (например, серия более высоких максимумов и минимумов).
- Во время отката дождитесь, когда цвет Elder Impulse станет синим (нейтральным).
- Входите в сделку, как только цвет сменится обратно в сторону тренда (зелёный для восходящего, красный для нисходящего).
- Торговля разворотами диапазона и сессии:
-
- Наблюдайте, как цена приближается к ключевой границе, например, проецируемому максимуму ADR или максимуму предыдущего дня.
- Ищите признаки истощения, например, когда цена не закрывается выше уровня, а цвет Elder Impulse становится синим или меняется на противоположный.
- Входите в сделку на разворот с целью на уровне 50% ADR или на другой стороне диапазона.
Полный список настраиваемых параметров
(Этот раздел даёт клиентам уверенность в гибкости продукта)
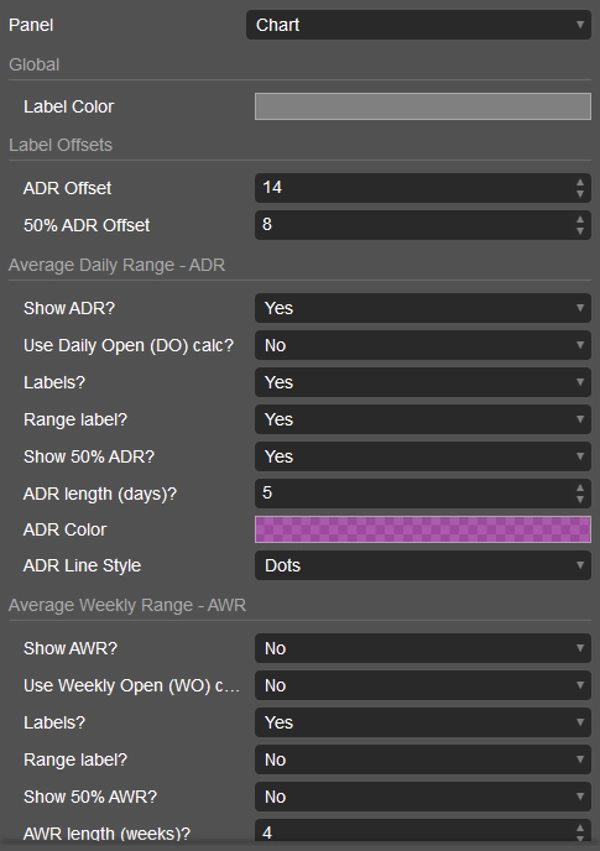
- Глобальные настройки: Цвета меток, смещения.
- Средний дневной диапазон (ADR): Включение/выключение, использование дневного открытия, отображение меток, отображение диапазона, отображение уровня 50%, период обратного просмотра, цвет, стиль линии.
- Средний недельный диапазон (AWR): Полностью настраиваемые параметры, аналогично ADR.
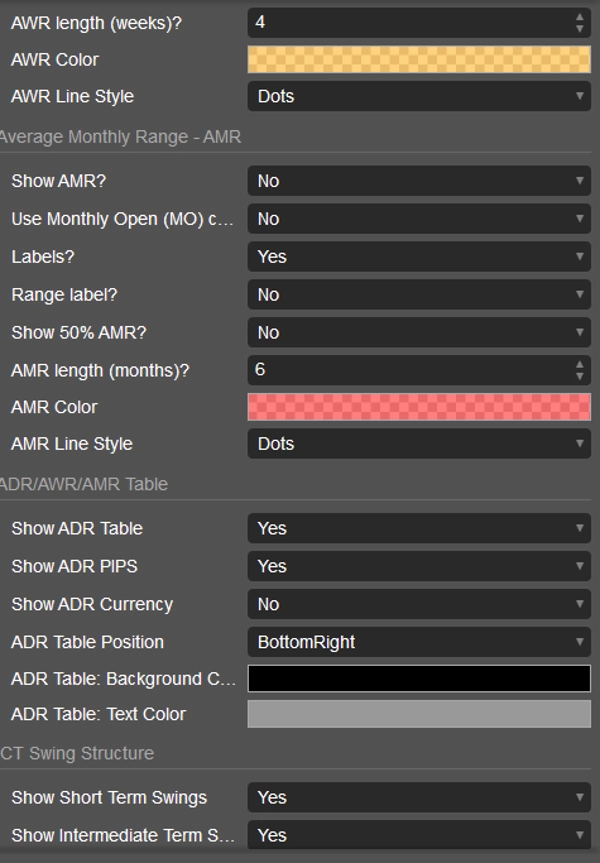
- Средний месячный диапазон (AMR): Полностью настраиваемые параметры, аналогично ADR.
- Таблица данных: Включение/выключение, отображение пипсов, отображение валюты, позиция на экране, цвета.
- Рыночная структура ICT: Независимое включение коротких, средних и долгих колебаний.
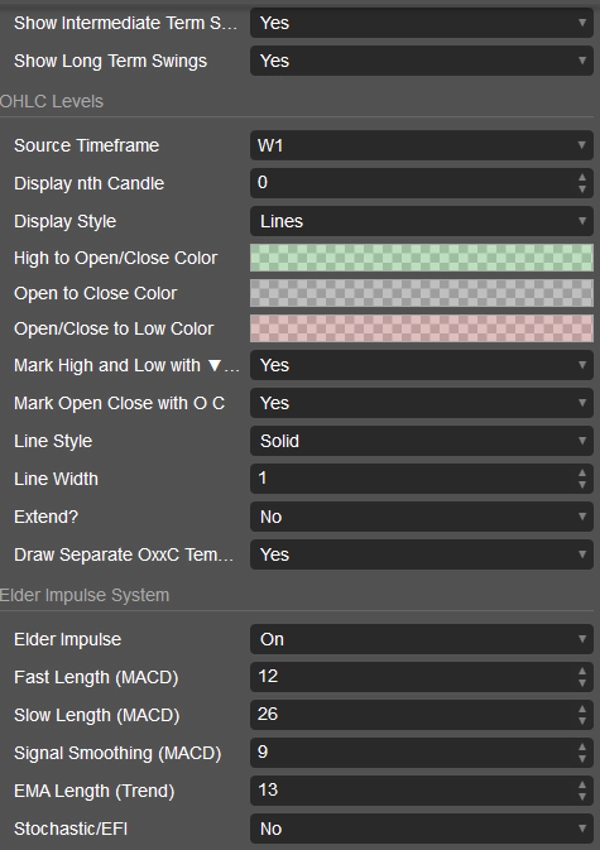
- Уровни OHLC: Таймфрейм источника, обратный просмотр свечей, стиль отображения (линии/боксы), все цвета, отметка максимумов/минимумов, отметка открытия/закрытия, расширение линий, отображение шаблона.
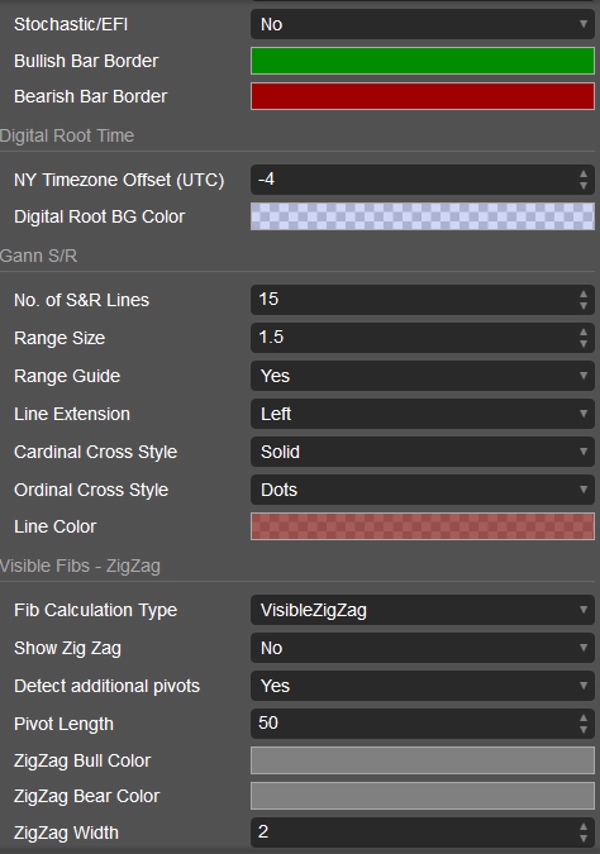
- Elder Impulse System: Включение/выключение, все параметры MACD и EMA, режим Stochastic/EFI, цвета границ бычьих/медвежьих баров.
- Digital Root Time: Смещение часового пояса Нью-Йорка, цвет фона.
- Gann S/R: Количество линий, размер диапазона, расширение линий, стили линий, цвет.
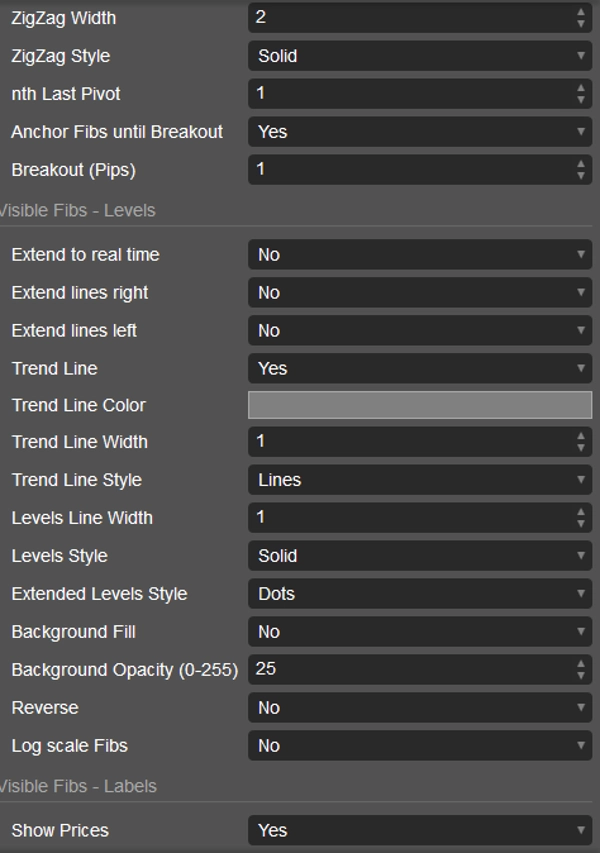
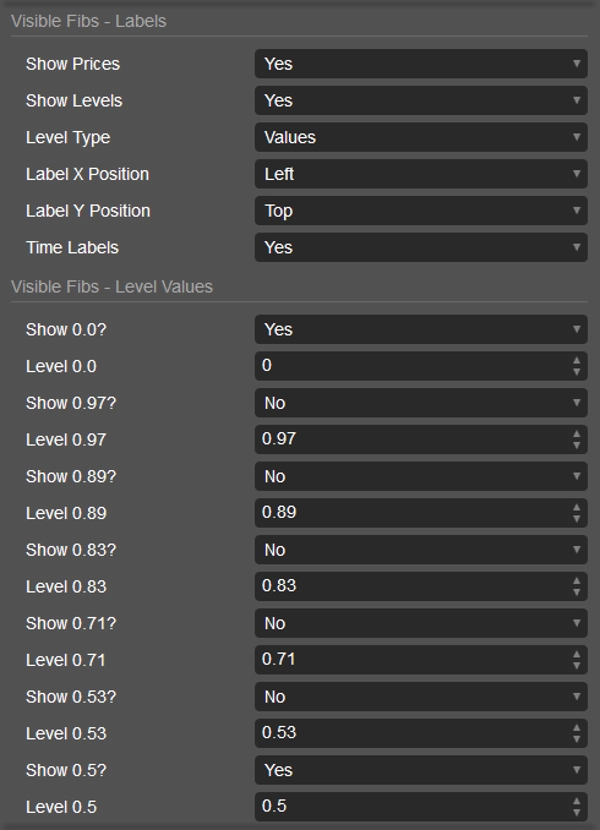
- Видимые уровни Фибоначчи: Тип расчёта (ZigZag/диапазон графика), отображение ZigZag (по умолчанию выключено), все параметры ZigZag, стабильное закрепление и сброс при пробое, все параметры уровней и линий, заливка фона, инверсия, логарифмический масштаб, управление метками и более 25 индивидуальных уровней Фибоначчи, которые можно включать, настраивать и перекрашивать.
Поднимите свою торговлю на новый уровень с лучшим набором инструментов для анализа ценового действия. Перестаньте рисовать линии и начните видеть торговые сигналы. Получите ADVANCED ICT SUITE PRO от LudwigICT уже сегодня! 🚀🚀🚀
Если у вас есть вопросы или возникли проблемы, не стесняйтесь обращаться ко мне. Я с радостью помогу вам!
Отказ от ответственности:
Используя мои алгоритмы, вы признаёте, что торговля связана с присущими рисками и что прошлые результаты не гарантируют будущих. Важно иметь надёжную стратегию управления рисками и, прежде всего, дисциплинированно соблюдать уровни стоп-лосс. Неправильное управление рисками может привести к значительным потерям. Я не несу ответственности за финансовые результаты, возникающие в результате использования этих алгоритмов. Торгуйте ответственно и всегда следуйте правилам управления рисками.
Благословений! 🙌
Сводка
Отзывы покупателей
5 | 50 % | |
4 | 50 % | |
3 | 0 % | |
2 | 0 % | |
1 | 0 % |


