
Описание
⚠️ Мы переехали на 👉 PrimeQuant
🚫🚫🚫 Не покупайте этот индикатор!
⚡ ДОСТУПНА ВЕРСИЯ НОВОГО ПОКОЛЕНИЯ: Этот классический инструмент LudwigICT был переработан, реструктурирован и выпущен под нашим новым брендом разработчика, PrimeQuant. Новая версия предлагает упрощённый интерфейс и обновлённые свойства для текущих рыночных условий. Получите обновлённую версию по цене с учётом скидки для пользователей старой версии здесь:
👉 Автоматическое обнаружение волн Эллиотта + Фибоначчи
👉 Автоматическое обнаружение волн Эллиотта + Фибоначчи
👉 Автоматическое обнаружение волн Эллиотта + Фибоначчи
(Обратите внимание: листинг LudwigICT остаётся активным для пользователей старой версии, но больше не будет получать обновления или активные ценовые скидки.)
📈 Волны Эллиотта – уровни Фибоначчи [LudwigICT]
🔥 Откройте всю мощь Теории волн Эллиотта в сочетании с динамическими уровнями Фибоначчи – всё автоматизировано для вас внутри cTrader!
Этот индикатор приносит профессиональный подсчёт волн и точные зоны Фибоначчи прямо на ваши графики, делая прогнозирование тренда и исполнение сделок проще, чем когда-либо.
✨ Ключевые особенности
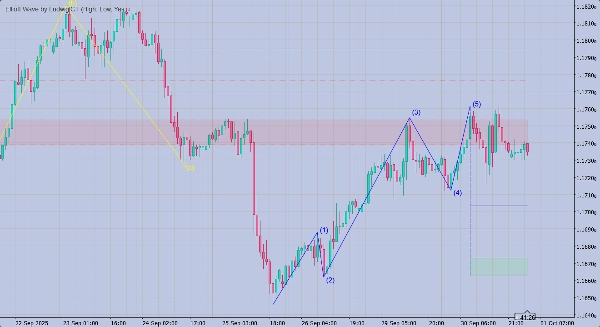
🔹 Автоматическое обнаружение волн
- Определяет 5-волновые мотивационные структуры (1–5).
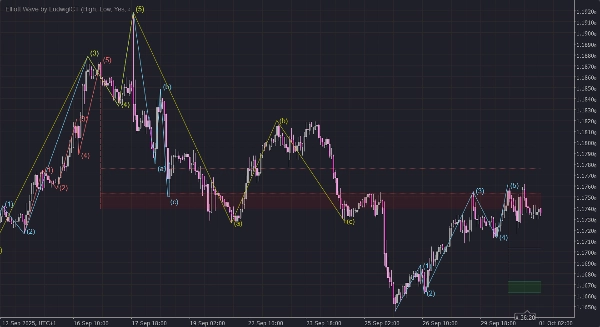
- Обнаруживает 3-волновые коррекционные паттерны (A–B–C) сразу после завершения мотивации.
🔹 Динамические уровни Фибоначчи
- Автоматически строит ключевые зоны отката: 0.500 • 0.618 • 0.764 • 0.854.
- Обновляется в реальном времени с развитием волн.
- Подсвечивает аннулирования пунктирными линиями.
🔹 Мульти-ZigZag структура
- Выполняет три независимых расчёта ZigZag с настраиваемой длиной и цветами.
- Обеспечивает гибкую чувствительность для разных рыночных условий.
🔹 Профессиональная визуализация
- Чистые метки волн
(1)…(5)и(a)(b)(c)размещены с умными смещениями на основе ATR. - Боксы прорыва с жирными маркерами X при пробитии уровней.
- Градиентные заливки Фибоначчи для лёгкого обнаружения.
🔹 Помощь в торговле
- Автоматическое определение возможной новой Волны (1) после коррекции A–B–C.
- Аудио оповещения о новых волнах, аннулированиях и сигналах прорыва.
🛠 Как использовать
- Примените к графику
-
- Просто перетащите Волны Эллиотта – уровни Фибоначчи [LudwigICT] на ваш график cTrader.
- Работает на всех таймфреймах (скальпинг, свинг, долгосрочный анализ).
- Настройте параметры
- Чтение волн
-
- ✅ Волны
(1–5)= Мотивационная волна (направление тренда). - 🔄 Волны
(a–b–c)= Коррекционная волна (контртренд). - 📊 Уровни Фибоначчи показывают вероятные зоны отката для входа/выхода из сделок.
- ✅ Волны
- Торгуйте с уверенностью
-
- Входите в сделки около уровней отката Фибоначчи после завершения мотивационной волны.
- Управляйте рисками при пробитии уровней (индикатор автоматически оповещает вас).
- Ищите иконку Следующая Волна (1), чтобы предвидеть новые циклы тренда.
🎯 Почему стоит выбрать этот индикатор?
✅ Экономит часы ручного подсчёта волн.
✅ Избегает субъективных ошибок в анализе волн Эллиотта.
✅ Чистая, точная, профессиональная визуализация прямо на вашем графике.
✅ Создан и оптимизирован LudwigICT, заслуживающим доверия в автоматизации торговли.
🖥 Совместимость
- Платформа: cTrader Desktop v5+
- Инструменты: Работает с Forex, акциями, индексами, товарами, криптовалютами.
- Таймфреймы: От 1-минутного скальпинга до еженедельного свинг-анализа.
⚡️ Начните прямо сейчас
🚀 Добавьте Волны Эллиотта – уровни Фибоначчи [LudwigICT] в свой торговый арсенал сегодня и поднимите анализ графиков на новый уровень!
👉 Идеально подходит трейдерам, которые полагаются на ценовое действие, структуру и уровни отката Фибоначчи для точного тайминга входов и выходов.
Если у вас есть вопросы или возникнут проблемы, не стесняйтесь связаться со мной. Я с радостью помогу вам!
Отказ от ответственности:
Используя мои алгоритмы, вы признаёте, что торговля связана с присущими рисками и что прошлые результаты не гарантируют будущих. Важно иметь надёжную стратегию управления рисками и, прежде всего, дисциплинированно соблюдать уровни стоп-лосс. Несоблюдение управления рисками может привести к значительным потерям. Я не несу ответственности за финансовые последствия, возникающие в результате использования этих алгоритмов. Торгуйте ответственно и всегда следуйте правилам управления рисками.
Благословений! 🙌
Сводка
Отзывы покупателей
5 | 100 % | |
4 | 0 % | |
3 | 0 % | |
2 | 0 % | |
1 | 0 % |


