
Описание
Мы переехали в 👉 PrimeQuant
🚫🚫🚫 Не покупайте этот индикатор!
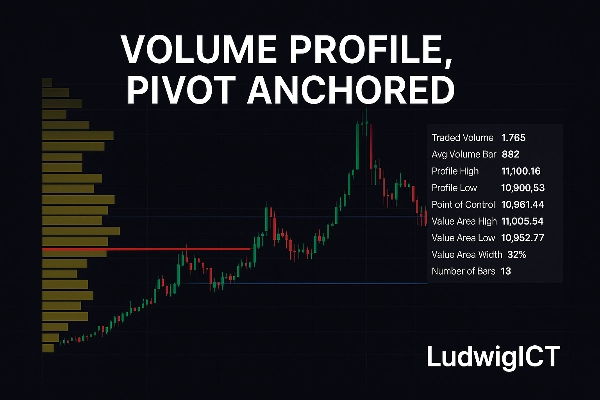
Индикатор Volume Profile, Pivot Anchored приносит профессиональный подход к анализу структуры рынка и объема непосредственно в cTrader. Созданный для трейдеров, которые ценят ясность, точность и практические инсайты, он показывает, как торговая активность распределяется по цене в значимых диапазонах колебаний.
⚡Эксклюзивное предложение – ограничено первыми 10 покупателями!⚡
Раскройте весь потенциал вашей торговой стратегии с этим мощным кастомным индикатором, созданным, чтобы дать вам точное преимущество на рынке. Этот инструмент разработан для серьезных трейдеров, которые хотят четкие, практические сигналы и улучшенное принятие решений при торговле XAU/USD и другими валютными парами Forex.
🚀 Почему стоит приобрести сейчас:
Доступно по специальной стартовой цене – только для первых 10 трейдеров
Получите доступ к продвинутым инсайтам по ценовому действию
Создан для высокой точности и надежности
Идеален как для скальпинга, так и для свинг-трейдинга
После продажи 10 копий это предложение больше не будет доступно по этой цене. Забронируйте свою копию сегодня и поднимите свою торговлю на новый уровень!
Что он делает?
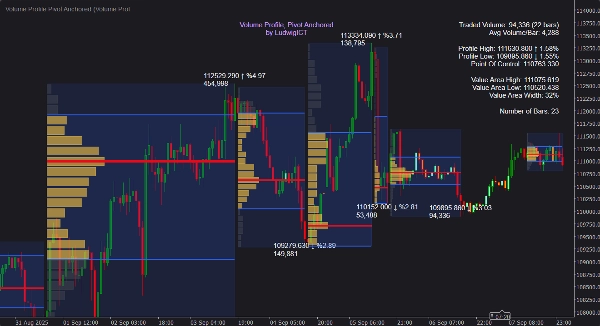
В отличие от фиксированных или сессионных профилей, этот инструмент автоматически привязывает объемные профили к значимым пивотам максимумов и минимумов, динамически отображая аукционный процесс каждого колебания. Это позволяет видеть, где участники рынка действительно вложили капитал — а не просто где цена случайно двигалась.
✨ Ключевые элементы включают:
📍 Автоматическое обнаружение пивотов – профили строятся между максимумами и минимумами колебаний, обновляясь по мере формирования новых пивотов.
📊 Детальное распределение объема – гистограммы показывают, как объем распределяется по цене, с разрешением и шириной, задаваемыми пользователем.
🎯 Уровни зоны стоимости и POC – мгновенный расчет и визуализация точки контроля (POC), верхней (VAH) и нижней (VAL) границ зоны стоимости.
📈 Развивающийся профиль – профиль с живым обновлением текущего участка дает перспективный контекст.
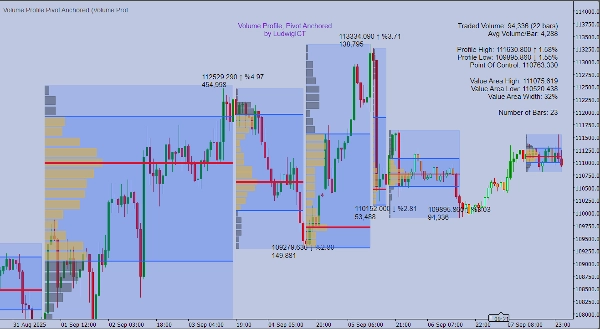
➡️ Продление зон POC – проецируйте POC вперед до тех пор, пока цена не коснется или не пересечет его, выделяя будущие зоны реакции.
📝 Информативные метки и подсказки – ценовые метки, % изменения, накопительный объем и чистая статистическая панель при наведении.
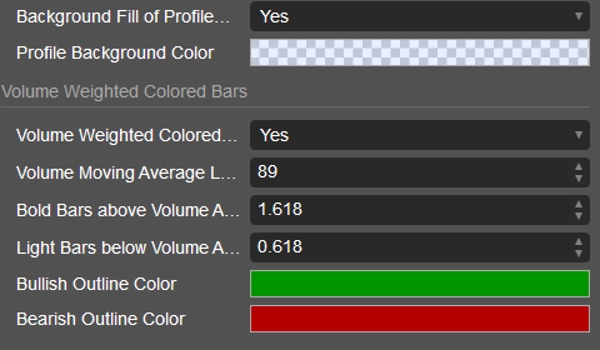
🎨 Окраска свечей по объему – свечи затенены в зависимости от интенсивности объема для быстрого распознавания паттернов.
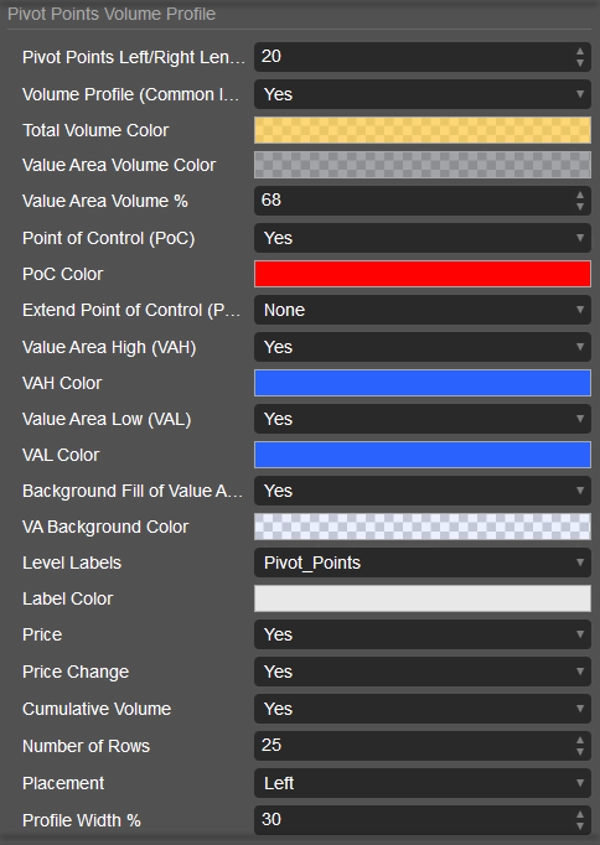
⚙️ Полная настройка – регулируйте цвета, расположение и отображение для бесшовной интеграции со стилем вашего графика.
Как использовать
1️⃣ Подключите к любому графику – работает на всех таймфреймах и инструментах.
2️⃣ Настройте длину пивота – контролируйте чувствительность к максимумам/минимумам колебаний (короче = больше профилей, длиннее = только основная структура).
3️⃣ Интерпретируйте профили в контексте:
• 🎯 POC – ценовой уровень с наибольшим объемом торгов, часто магнит.
• 📏 VAH / VAL – границы зоны стоимости, мощная поддержка/сопротивление.
• 🌀 Форма гистограммы – определяйте зоны баланса, отторжения и сдвиги распределения.
4️⃣ Следите за развивающимся профилем – наблюдайте, как строится структура аукциона в реальном времени.
5️⃣ Используйте оповещения – получайте уведомления, когда цена взаимодействует с POC, VAH, VAL или появляются бары с высоким объемом.
6️⃣ Применяйте как основу – уточняйте входы на уровнях, основанных на объеме, предвидьте развороты и подтверждайте тренды через структуру объема.
Почему трейдеры используют его
Этот индикатор преобразует необработанный объем в значимую структуру. Привязывая профили к пивотам, он адаптируется к динамике рынка в реальном времени, а не опирается на произвольные сессионные разбиения. Независимо от того, внутридневная, свинг или позиционная торговля, распределение объема с привязкой дает более глубокое понимание для принятия решений.
Ключевые параметры в обзоре
⚙️ Чувствительность пивота – определяет, насколько агрессивно обнаруживаются точки колебаний.
📊 Уровни и ширина профиля – контролируйте разрешение и видимость профиля.
🎯 Режимы расширения POC – Нет, до последнего бара, до касания или до пересечения.
📏 Процент зоны стоимости – полностью настраиваемый (по умолчанию 68%).
🎨 Окраска по объему – пороги для выделения сильного/слабого участия.
Volume Profile, Pivot Anchored от LudwigICT — это не просто визуализация, а структурный взгляд на то, как рынки действительно проводят аукционы. Для трейдеров, требующих профессиональных инструментов, он предоставляет решающее преимущество в понимании взаимодействия цены и объема.
Если у вас есть вопросы или возникли проблемы, не стесняйтесь связаться со мной. Я с радостью помогу вам!
Отказ от ответственности:
Используя мои алгоритмы, вы признаёте, что торговля связана с присущими рисками и что прошлые результаты не гарантируют будущих. Важно иметь надежную стратегию управления рисками и, прежде всего, дисциплинированно соблюдать уровни стоп-лосс. Неправильное управление рисками может привести к значительным потерям. Я не несу ответственности за финансовые результаты, возникающие в результате использования этих алгоритмов. Торгуйте ответственно и всегда следуйте правилам управления рисками.
Всего доброго! 🙌
Сводка
Отзывы покупателей
5 | 67 % | |
4 | 33 % | |
3 | 0 % | |
2 | 0 % | |
1 | 0 % |


