
Opis
Ultimate Trend ADX to potężna i dopracowana wersja klasycznego Wskaźnika Kierunkowego Średniego (ADX), zaprojektowana, aby dać traderom jaśniejszy, bardziej dynamiczny obraz trendów rynkowych i momentum. W przeciwieństwie do standardowego ADX, to ulepszone narzędzie stosuje zaawansowane techniki wygładzania (EMA lub KAMA) oraz wprowadza opcje skalowania, aby linie wskaźnika były bardziej responsywne i wizualnie wyraziste. Efektem jest wskaźnik klasy profesjonalnej, który pomaga zidentyfikować silne trendy, zauważyć odwrócenia i potwierdzić wejścia z większą pewnością.
Jak czytać wskaźnik
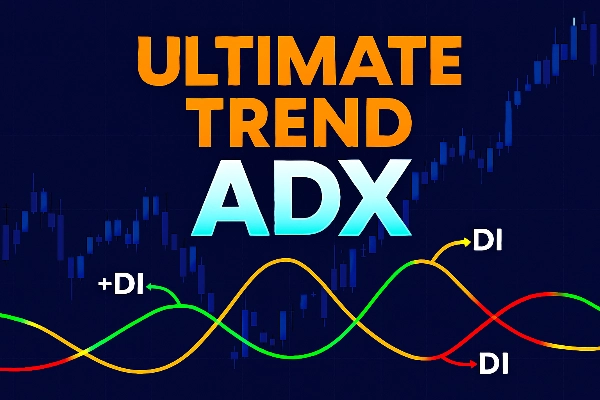
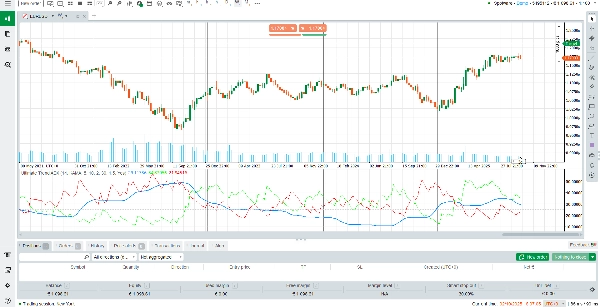
Ultimate Trend ADX wyświetla trzy kluczowe linie w osobnym oknie pod wykresem:
Linia ADX (niebieska/żółta): Mierzy ogólną siłę trendu. Rosnący ADX wskazuje na wzmacniający się trend, podczas gdy spadający ADX sugeruje osłabienie momentum. Wartości powyżej 25 zazwyczaj sygnalizują silny trend.
Linia +DI (zielona): Reprezentuje byczy ruch kierunkowy. Gdy +DI jest powyżej –DI, kupujący mają kontrolę.
Linia –DI (czerwona): Reprezentuje niedźwiedzi ruch kierunkowy. Gdy –DI jest powyżej +DI, sprzedający dominują na rynku.
Odczytywanie sygnałów jest proste:
Gdy +DI przecina od dołu –DI, a ADX rośnie, sugeruje to silny trend byczy.
Gdy –DI przecina od dołu +DI, a ADX rośnie, sygnalizuje to silny trend niedźwiedzi.
Gdy ADX jest poniżej 20–25, rynek zwykle znajduje się w fazie konsolidacji lub brakuje mu wyraźnego kierunku.
Wskaźnik zawiera również poziome poziomy na 0, 25, 50, 75 i 100, które pomagają szybko ocenić intensywność trendu.
Jak działa wskaźnik
Ultimate Trend ADX opiera się na standardowym Systemie Ruchu Kierunkowego, ale został ulepszony o nowoczesne algorytmy wygładzania:
Wykładnicza Średnia Krocząca (EMA): Zapewnia szybką, responsywną opcję wygładzania dla traderów chcących uchwycić krótkoterminowe momentum.
Adaptacyjna Średnia Krocząca Kaufmana (KAMA): Dynamicznie dostosowuje się do zmienności rynku, filtrując szumy podczas ruchów bocznych, a jednocześnie pozostając czułą podczas silnych trendów.
Czynnik skalujący dla +DI i –DI: Wzmacnia zielone i czerwone linie, czyniąc sygnały bycze i niedźwiedzie bardziej widocznymi i łatwiejszymi do interpretacji na wykresie.
To połączenie zapewnia, że wskaźnik dostosowuje się do różnych warunków rynkowych, dając Ci zarówno klarowność, jak i precyzję.
Kluczowe cechy
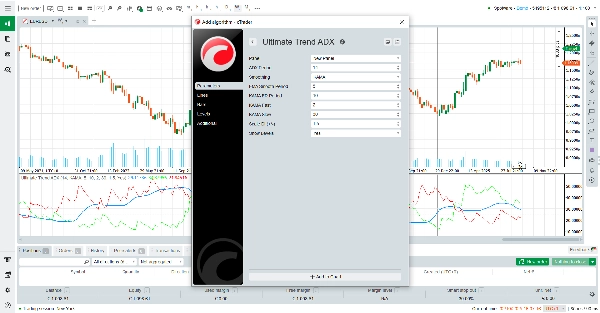
Ulepszony obliczanie ADX – Wykorzystuje wygładzanie EMA lub KAMA dla dokładniejszego i bardziej adaptacyjnego pomiaru siły trendu.
Wyraźne sygnały wizualne – Wyraźne kodowanie kolorów (niebieski/żółty dla ADX, zielony dla +DI, czerwony dla –DI) sprawia, że interpretacja jest intuicyjna.
Regulowana czułość – Parametry pozwalają na precyzyjne dostosowanie responsywności do Twojego stylu handlu.
Wbudowane poziome poziomy – Poziomy odniesienia (0/25/50/75/100) pomagają natychmiast ocenić intensywność trendu.
Dlaczego warto wybrać Ultimate Trend ADX?
Sukces w handlu często zależy od umiejętności rozpoznania, kiedy rynek jest w trendzie, a kiedy nie. Ultimate Trend ADX daje Ci tę przewagę, łącząc niezawodność klasycznego ADX z nowoczesnymi ulepszeniami, które czynią go ostrzejszym, jaśniejszym i bardziej użytecznym. Niezależnie od tego, czy handlujesz na rynku forex, akcjami, indeksami czy towarami, ten wskaźnik pomoże Ci odfiltrować szumy, potwierdzić sygnały i pozostać zgodnym z dominującym kierunkiem rynku.
Podsumowanie
This indicator incorporates exponential moving average (EMA) or Kaufman’s adaptive moving average (KAMA) smoothing techniques to improve responsiveness and reduce noise. It also features a scaling factor for the +DI and –DI lines, enhancing signal visibility. Horizontal reference levels at 0, 25, 50, 75, and 100 assist in quickly assessing trend intensity.
Ultimate Trend ADX supports multiple markets including forex, stocks, indices, commodities, and cryptocurrencies. It is suitable for various trading strategies such as scalping, breakout, and grid trading. Adjustable sensitivity settings allow customization to fit different trading styles. This tool aids traders in identifying strong trends, spotting reversals, and confirming entry signals with improved clarity and precision.
Opinie klientów
5 | 100 % | |
4 | 0 % | |
3 | 0 % | |
2 | 0 % | |
1 | 0 % |


![Logo „Gaussian Channel [Iridio Capital]”](https://cdn.ctrader.com/image/webp/7c039209-5573-4a54-a072-f9528b503103_41960)
![Logo „High-Low Divergence [Iridio Capital]”](https://cdn.ctrader.com/image/webp/443c4661-7abb-40f1-842f-4b6ec560649b_40914)


