
PrevDayProjection
Wskaźnik
221 pobrania
Wersja 1.0, Sep 2025
Windows, Mac
Opis
Poziomy projekcji z poprzedniego dnia
Odblokuj precyzyjne handel dzięki dynamicznym projekcjom Fibonacciego opartym na wczorajszej akcji cenowej.
Ten wskaźnik automatycznie oblicza maksimum i minimum poprzedniego dnia, określa zakres, a następnie projekcje poziomów Fibonacciego zarówno powyżej, jak i poniżej tego zakresu — dając natychmiastowe punkty odniesienia dla potencjalnych stref wsparcia, oporu i wybicia.
Kluczowe cechy
- 📅 Automatyczne wykrywanie maksimum i minimum poprzedniego dnia
- 📏 Projekcje Fibonacciego oparte na zakresie na poziomach 38,2%, 50%, 61,8% i 100%
- 🔼 Powyżej poprzedniego maksimum: Cztery poziomy Fibonacciego jako cele kontynuacji wzrostowej
- 🔽 Poniżej poprzedniego minimum: Cztery poziomy Fibonacciego jako cele kontynuacji spadkowej
- 🎯 Linie tylko na segmentach zaczynające się od pierwszego słupka dzisiejszego dnia — bez bałaganu na wykresie
- 🏷 Etykiety cenowe na prawej krawędzi dla szybkiego podglądu
- 🎨 Kolory i grubość linii do personalizacji, dopasowane do stylu wykresu
Dlaczego traderzy to kochają
- Jasna mapa drogowa intraday: Dokładnie wiesz, gdzie są kluczowe poziomy przed rozpoczęciem sesji.
- Analiza dwukierunkowa: Planuj zarówno ruchy wzrostowe, jak i spadkowe.
- Oszczędność czasu dzięki automatyzacji: Bez ręcznego rysowania czy przeliczania.
- Działa na każdym interwale czasowym: Od skalpowania po swing trading.
Idealne dla
- Traderów dziennych szukających precyzyjnych celów wybicia
- Traderów swingowych identyfikujących kluczowe strefy cofnięć
- Każdego, kto używa poziomów Fibonacciego jako części swojej strategii
💡 Wskazówka: Połącz ten wskaźnik z ulubionymi narzędziami do analizy momentum lub wolumenu, aby potwierdzić wejścia i wyjścia wokół tych prognozowanych poziomów.
Podsumowanie
Podsumowanie AI
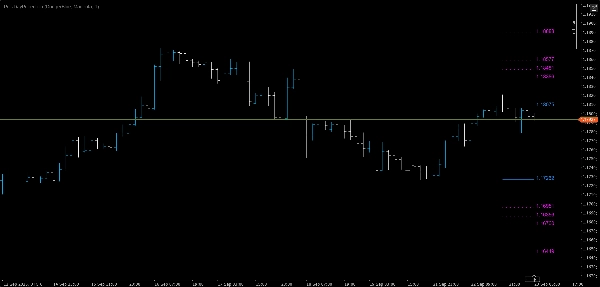
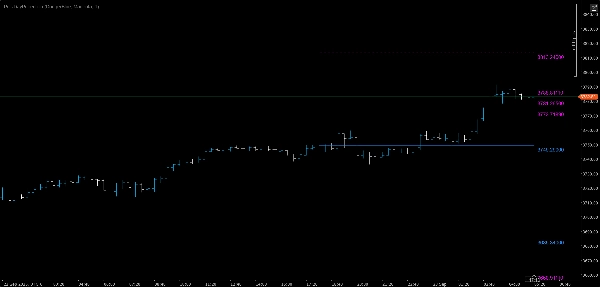
PrevDayProjection is a technical indicator designed for trading platforms that automatically calculates the previous trading day’s high and low prices, determines the range, and projects Fibonacci levels based on that range. It generates key Fibonacci retracement and extension levels at 38.2%, 50%, 61.8%, and 100% both above the previous high and below the previous low. These levels serve as potential support, resistance, and breakout zones.
The indicator displays segment-only lines starting from the current day’s first bar to avoid chart clutter and includes price labels at the right edge for quick reference. Users can customize colors and line thickness to fit their chart style. It supports any timeframe, making it suitable for scalping, day trading, and swing trading.
PrevDayProjection is applicable across multiple markets including Forex, Indices, Commodities, and Crypto, with specific tags indicating symbols like EURUSD, XAUUSD (gold), and NAS100. It provides traders with a clear intraday roadmap and dual-direction analysis to plan for both bullish and bearish moves. The tool automates manual calculations, saving time and enhancing precision in identifying breakout targets and retracement zones.
Profil wskaźnika
Opinie klientów
0.0
Opinie: 0
Opinie klientów
Ten produkt nie ma jeszcze opinii. Wypróbowałeś(-aś) go już? Bądź pierwszy(-a) i powiedz o tym innym!
Dyskusja
Częste pytania
Forex
Indices
EURUSD
Commodities
Crypto
XAUUSD
NAS100
Produkty dostępne za pośrednictwem cTrader Store, w tym boty handlowe, wskaźniki i wtyczki, dostarczane są przez deweloperów zewnętrznych i udostępniane wyłącznie w celach informacyjnych oraz w celu zapewnienia dostępu technicznego. cTrader Store nie jest brokerem i nie zapewnia doradztwa inwestycyjnego, nie udziela spersonalizowanych rekomendacji ani nie gwarantuje przyszłych wyników.


![Logo „High-Low Divergence [Iridio Capital]”](https://cdn.ctrader.com/image/webp/443c4661-7abb-40f1-842f-4b6ec560649b_40914)


![Logo „[Hamster-Coder] Pivot Points MTF”](https://cdn.ctrader.com/image/webp/4c143e5a-309c-40e3-a578-f04d1e133ffa_31159)


Cena
26
Sprzedaż
2.17K
Bezpłatne instalacje