

Opis
# 🚀 Wskaźnik Kinetycznego Poślizgu (KSI) – Zaawansowane Narzędzie do Analizy Presji Rynkowej i Płynności
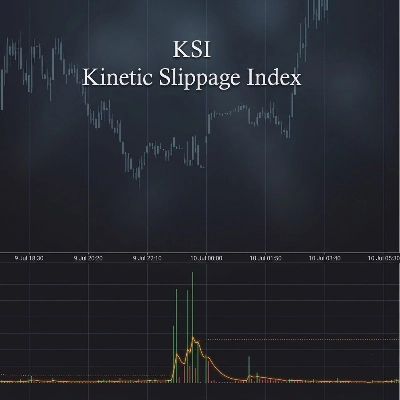
Odkryj głębsze spostrzeżenia rynkowe dzięki **Wskaźnikowi Kinetycznego Poślizgu (KSI)** — potężnemu wskaźnikowi handlowemu zaprojektowanemu do identyfikacji nietypowych ruchów cen, nierównowagi wolumenu oraz potencjalnych zdarzeń płynności zanim staną się one oczywiste na wykresie.
Stworzony dla traderów analizujących **strukturę rynku, zachowanie wolumenu, zmienność oraz aktywność instytucjonalną**, KSI łączy rozszerzenie zakresu i dynamikę wolumenu, aby mierzyć nienormalne warunki rynkowe.
## 🔥 Kluczowe Funkcje
✅ **Obliczanie Wskaźnika Kinetycznego Poślizgu**
* Mierzy zależność między ruchem ceny a wolumenem obrotu.
* Wykrywa sytuacje, w których cena porusza się nieproporcjonalnie w stosunku do normalnego zachowania wolumenu.
* Pomaga zidentyfikować potencjalny stres płynności, agresywną aktywność rynkową oraz nietypowy impet.
✅ **Adaptacyjne Wykrywanie Skoków**
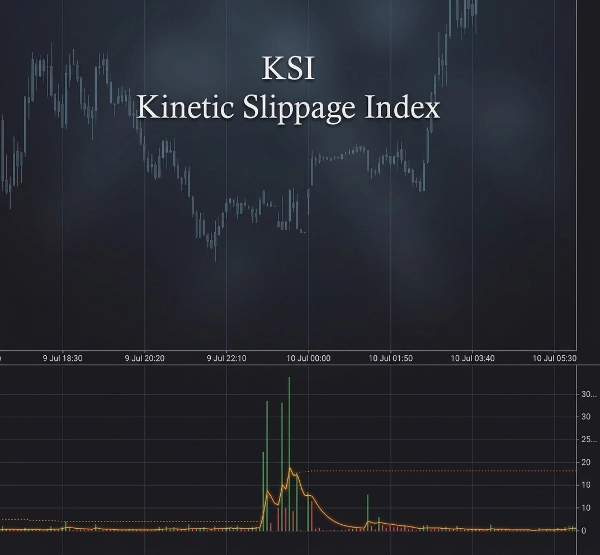
* Automatycznie oblicza dynamiczne poziomy skoków na podstawie ostatniego zachowania rynku.
* Wykorzystuje analizę odchylenia statystycznego do podkreślenia ekstremalnych zdarzeń rynkowych.
* Dostosowuje się do zmieniających się warunków zmienności bez konieczności ciągłych ręcznych korekt.
✅ **Alerty Skoków w Czasie Rzeczywistym 🚨**
* Otrzymuj powiadomienia, gdy występuje nienormalna dywergencja wolumenu/zasięgu.
* Pomaga traderom szybko zidentyfikować potencjalne warunki wybicia, przejęcia płynności lub nagłej presji rynkowej.
✅ **Analiza Wolumenu i Przepływu 📊**
* Śledzi aktualny wolumen w porównaniu do jego średniej EMA.
* Podkreśla, gdy aktywność handlowa jest wyjątkowo wysoka.
* Zawiera analizę skumulowanej delty, aby wizualizować presję kupna i sprzedaży.
✅ **Potwierdzenie Linii Sygnału 📈**
* Wygładzane obliczanie sygnału pomaga zidentyfikować zmiany impetu KSI.
* Zielono/czerwony histogram ułatwia odczyt zmian presji rynkowej.
## 🕒 Inteligencja Sesji Handlowych
KSI zawiera automatyczne śledzenie sesji rynkowych:
🌏 Sesja Azjatycka
🇬🇧 Sesja Londyńska
🇺🇸 Nowy Jork AM
☕ Przerwa obiadowa w Nowym Jorku
🌆 Nowy Jork PM
Wbudowany wyświetlacz killzone pomaga traderom zrozumieć, kiedy płynność i zmienność są zazwyczaj wyższe.
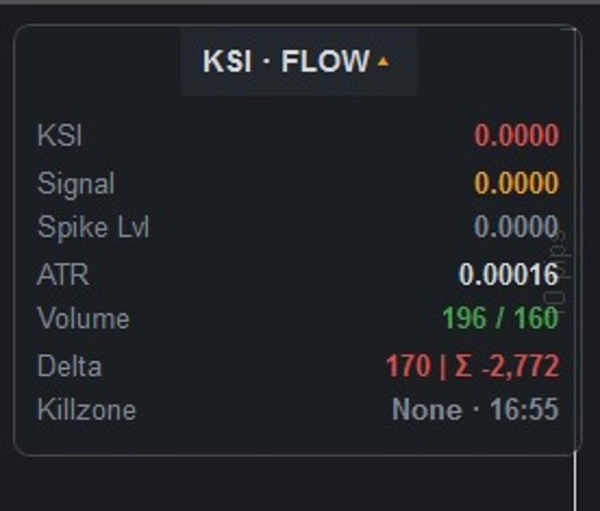
## 📌 Profesjonalny Panel Informacyjny
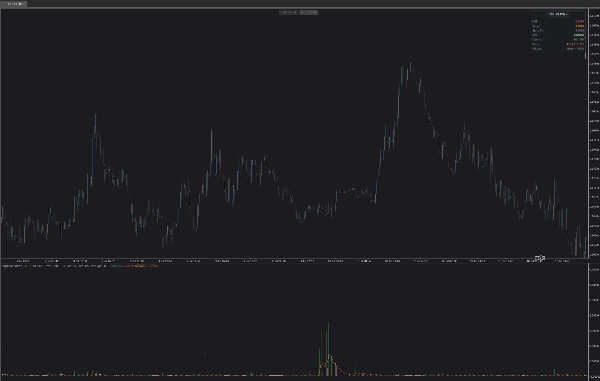
Zintegrowany pulpit zapewnia przejrzysty przegląd bezpośrednio na Twoim wykresie:
📍 Aktualna wartość KSI
📍 Poziom sygnału
📍 Adaptacyjny próg skoków
📍 Odczyt zmienności ATR
📍 Aktualny wolumen vs średni wolumen
📍 Delta i skumulowana delta
📍 Aktywna sesja handlowa / killzone
Panel może być:
* ✅ Umieszczony w dowolnym rogu wykresu
* ✅ Złożony lub rozwinięty
* ✅ Dostosowany z niestandardową przezroczystością
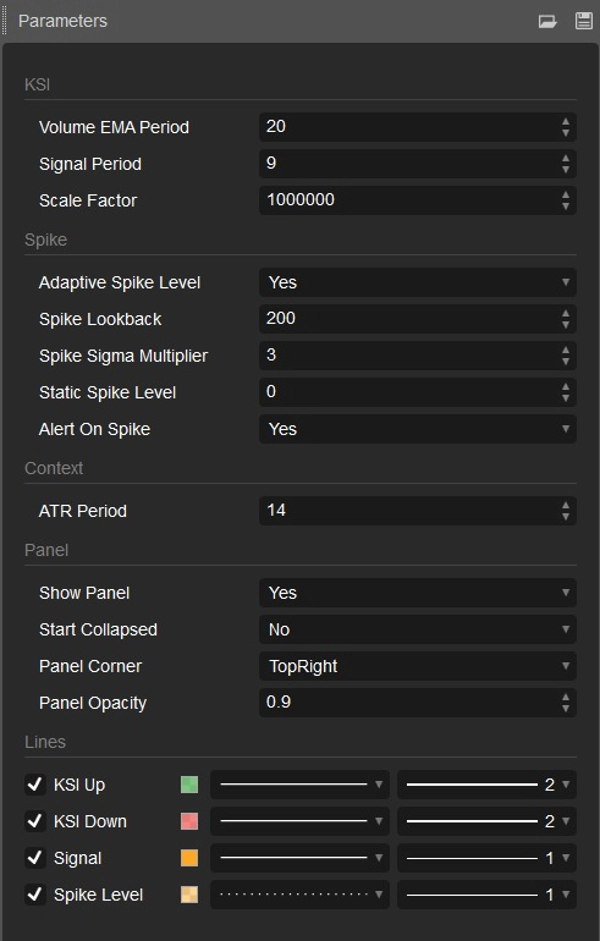
## ⚙️ Ustawienia Konfigurowalne
Dopasuj KSI do dowolnego stylu handlu:
🔧 Okres EMA wolumenu
🔧 Okres sygnału
🔧 Współczynnik skali
🔧 Adaptacyjne lub stałe wykrywanie skoków
🔧 Okres cofania się skoków
🔧 Mnożnik czułości skoków
🔧 Okres ATR
🔧 Ustawienia wyglądu panelu
## 🎯 Zaprojektowany Dla
✔ Traderów Forex
✔ Traderów Futures
✔ Traderów Kryptowalut
✔ Skalperów
✔ Traderów Dziennych
✔ Analityków struktury rynku
✔ Traderów szukających potwierdzenia opartego na wolumenie
## 💡 Jak Traderzy Używają KSI
KSI może pomóc zidentyfikować:
⚡ Nietypową aktywność rynkową
⚡ Potencjalną presję wybicia
⚡ Dywergencję wolumen-cena
⚡ Zdarzenia płynności
⚡ Zmiany impetu
⚡ Możliwości handlu o wysokiej zmienności
Połącz KSI z istniejącą strategią, aby uzyskać jaśniejszy obraz **kiedy rynek porusza się normalnie — a kiedy dzieje się coś nietypowego.**
📈 Handluj mądrzej. Zrozum presję rynkową. Wykrywaj ukrytą aktywność dzięki Wskaźnikowi Kinetycznego Poślizgu.
Podsumowanie
The indicator includes volume and flow analysis by comparing current volume to its exponential moving average (EMA) and incorporates cumulative delta analysis to visualize buying and selling pressure. A smooth signal line and histogram help confirm changes in KSI momentum, making shifts in market pressure easier to interpret.
KSI tracks major trading sessions—Asia, London, and New York (AM, Lunch, PM)—highlighting periods of higher liquidity and volatility. A professional information panel displays key metrics such as current KSI value, signal level, adaptive spike threshold, ATR volatility, volume comparisons, delta values, and active trading sessions. This panel is customizable in position, size, and opacity.
Settings allow fine-tuning of volume EMA period, signal period, scale factor, spike detection parameters, ATR period, and panel appearance. KSI is suitable for forex, futures, and crypto traders, including scalpers, day traders, and market structure analysts seeking volume-based confirmation and insights into unusual market activity, breakout pressure, liquidity events, and momentum changes.
Dyskusja
Opinie klientów
5 | 0 % | |
4 | 100 % | |
3 | 0 % | |
2 | 0 % | |
1 | 0 % |
Częste pytania
Więcej od tego autora













Cena