Deskripsi
📈 Indikator AutoFibRetracement
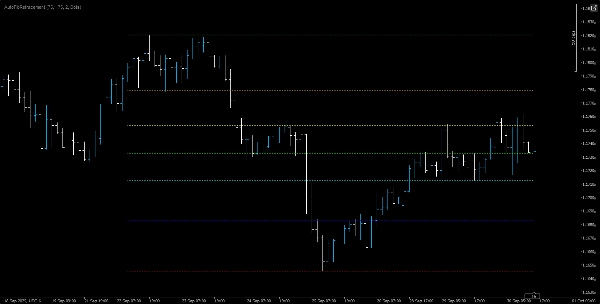
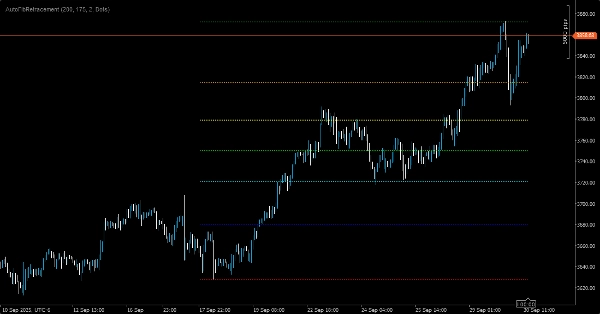
Indikator AutoFibRetracement adalah alat overlay yang kuat yang dirancang untuk secara otomatis menggambar level retracement Fibonacci berdasarkan ayunan harga terbaru. Ideal untuk trader yang ingin mengidentifikasi zona support dan resistance potensial, indikator ini secara dinamis menghitung level retracement menggunakan parameter yang dapat disesuaikan dan menampilkannya langsung di grafik.
🔧 Fitur Utama:
• Deteksi Ayunan Otomatis: Menghitung titik tertinggi dan terendah ayunan dalam jendela lookback yang ditentukan pengguna.
• Jendela Periode yang Dapat Disesuaikan: Trader harus memilih jendela yang tepat untuk secara akurat menangkap titik tertinggi dan terendah ayunan yang bermakna. Pilihan ini sangat penting untuk menyelaraskan level retracement dengan struktur pasar yang sebenarnya.
• Level Fibonacci: Termasuk rasio standar — 0%, 23,6%, 38,2%, 50%, 61,8%, 78,6%, dan 100% — masing-masing diberi kode warna untuk kejelasan visual.
• Opsi Gaya Visual:
• Opacity yang dapat disesuaikan (0–255) untuk transparansi garis.
• Ketebalan dan gaya garis yang dapat dikonfigurasi (misalnya, titik-titik, solid).
• Tampilan Overlay: Menggambar langsung di grafik harga untuk integrasi mulus dengan alat analisis teknikal lainnya.
🎯 Kasus Penggunaan:
Sangat cocok untuk trader ayunan, pengikut tren, dan analis teknikal yang mengandalkan zona retracement Fibonacci untuk merencanakan entri, keluar, dan level stop-loss. Efektivitas indikator ini bergantung pada kemampuan trader untuk memilih ukuran jendela yang tepat — terlalu pendek bisa melewatkan ayunan yang lebih luas, terlalu panjang bisa mengaburkan aksi harga terbaru.