
Deskripsi
RINGKASAN
Indikator Balance of Power mengukur kekuatan pembeli versus penjual dengan menilai kemampuan masing-masing pihak untuk mendorong harga ke level ekstrem.
Diperkenalkan oleh Igor Levshin dalam edisi Agustus 2001 majalah Technical Analysis of Stocks & Commodities, BOP menghitung rasio pergerakan harga dalam rentang setiap bar untuk mengungkap dinamika kekuatan internal yang independen dari arah harga.
KONSEP
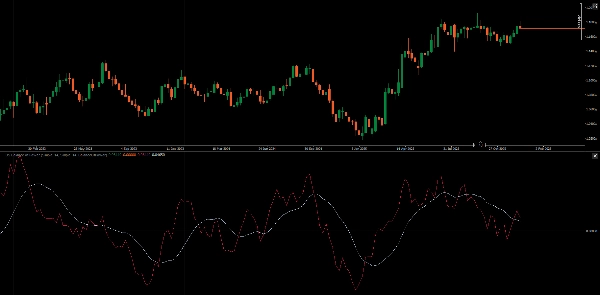
Balance of Power mengukur di mana harga ditutup dalam rentang setiap bar untuk mengungkap pertarungan internal antara pembeli dan penjual.
Prinsip dasarnya sederhana: pembeli mendorong harga ke atas, penjual mendorong ke bawah. Di mana harga akhirnya ditutup dalam rentang tersebut mengungkap siapa yang mendominasi periode perdagangan.
Nilai mentah dihaluskan menggunakan rata-rata bergerak untuk mengurangi noise dan mengungkap tekanan arah yang berkelanjutan, mengubah pembacaan bar per bar yang tidak stabil menjadi pengukur momentum yang bersih yang melacak pergeseran kontrol pasar.
APLIKASI STRUKTUR PASAR
BOP menyediakan analisis kekuatan internal yang dapat mengonfirmasi atau bertentangan dengan struktur harga:
Identifikasi Fase Tren
- Uptrend kuat: BOP konsisten di atas nol dengan titik terendah yang lebih tinggi
- Downtrend kuat: BOP konsisten di bawah nol dengan titik tertinggi yang lebih rendah
- Konsolidasi: BOP berosilasi di sekitar garis nol
- Zona transisi: BOP menembus struktur sebelumnya (higher high/lower low)
Konfluensi Support/Resistance
- BOP kembali ke nol sering bertepatan dengan harga yang menguji level kunci
- Pembacaan ekstrem BOP (+0,8 hingga +1,0 atau -0,8 hingga -1,0) dapat menunjukkan kelelahan di dekat struktur
- Divergensi pada level struktur menunjukkan potensi penolakan atau tembusan
Distribusi/Akumulasi
- Harga naik dengan BOP menurun: potensi fase distribusi
- Harga turun dengan BOP naik: potensi fase akumulasi
- Divergensi ini paling signifikan di dekat level struktur utama
STRATEGI MULTI-TIMEFRAME
Menggunakan BOP di berbagai timeframe memberikan konteks dan presisi:
1. Timeframe Lebih Tinggi (HTF) - Bias Arah:
- BOP Harian/4H di atas nol → cari peluang beli pada timeframe lebih rendah
- BOP Harian/4H di bawah nol → cari peluang jual pada timeframe lebih rendah
- BOP HTF menyeberang nol → pergeseran tren besar, tunggu konfirmasi
2. Timeframe Lebih Rendah (LTF) - Waktu Masuk:
- BOP 1H/15M sejalan dengan HTF → setup probabilitas tinggi
- Persilangan BOP/Sinyal LTF dalam arah HTF → pemicu masuk
- Perluasan histogram LTF mengonfirmasi momentum
3. Penyelarasan Timeframe:
- Semua timeframe sepakat → perdagangan dengan keyakinan terkuat
- HTF dan LTF berbeda → tunggu penyelesaian atau hindari perdagangan
- Pembalikan LTF melawan HTF → potensi scalp kontra-tren saja
GARIS SINYAL & HISTOGRAM
Garis Sinyal (MA dari BOP):
- Persilangan BOP/Sinyal memberikan sinyal masuk/keluar yang difilter
- Kemiringan garis sinyal menunjukkan keberlanjutan momentum
- Jarak antara BOP dan Sinyal menunjukkan perpanjangan pergerakan
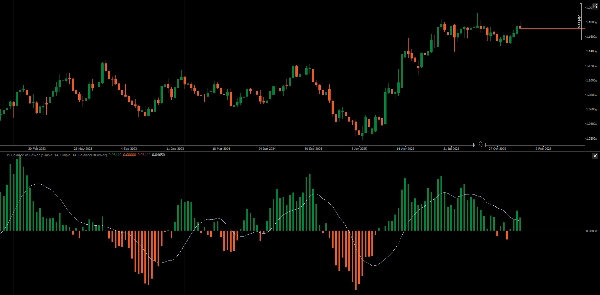
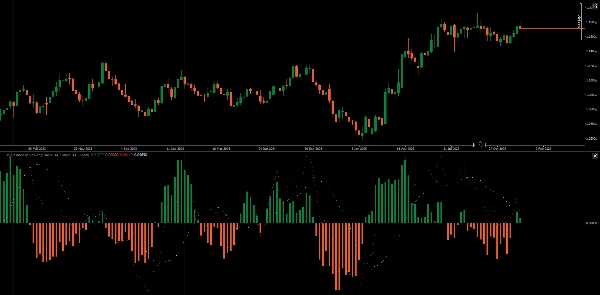
Mode Histogram:
- Mode Nilai: Menampilkan polaritas BOP relatif terhadap nol (dominasi pembeli/penjual)
- Mode Sinyal: Menampilkan selisih BOP - Sinyal, mengungkap pergeseran momentum lebih awal daripada persilangan
Dalam mode Sinyal, persilangan garis nol histogram terjadi sebelum persilangan garis BOP/Sinyal, memberikan peringatan dini perubahan momentum.
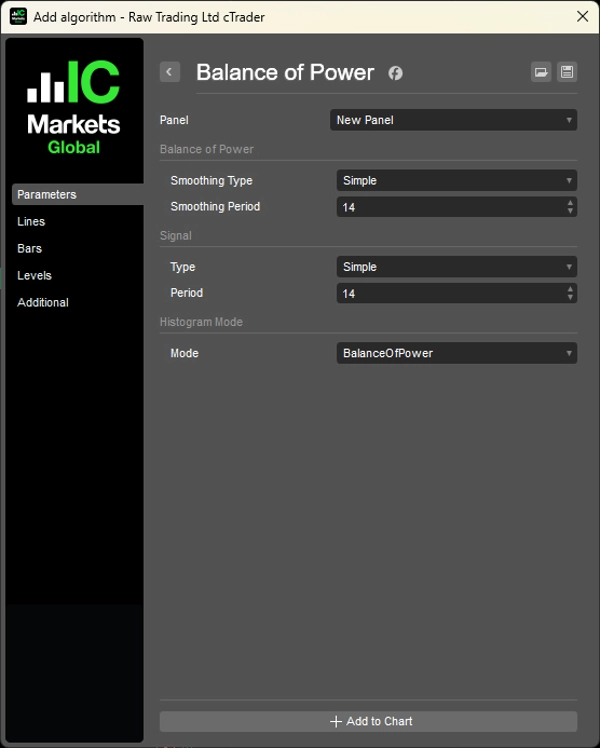
FITUR
- Periode Penghalusan: Periode MA yang dapat disesuaikan untuk BOP (default 14)
- Jenis Penghalusan: Pilihan jenis MA (SMA, EMA, dll.)
- Periode Sinyal: Periode MA yang dapat disesuaikan untuk garis Sinyal (default 14)
- Jenis Sinyal: Pilihan jenis MA untuk garis Sinyal
- Mode Histogram: Beralih antara tampilan Nilai dan selisih Sinyal
CONTOH PRAKTIS
- HTF (Harian): BOP di atas nol dan naik → bias bullish
- Harga mundur ke support
- LTF (1H): BOP menyeberang di atas Sinyal → pemicu masuk
- Histogram (mode Sinyal) mengembang → mengonfirmasi percepatan momentum
- Keluar saat histogram LTF menyusut atau BOP menyeberang di bawah Sinyal
__________________________________________________________________________________________
INDIKATOR GRATIS LAINNYA
Jelajahi berbagai alat analisis pasar—dari struktur dan volume hingga regresi, volatilitas, dan timeframe kustom.
Kode sumber tersedia di repository GitHub.
Semua gratis untuk digunakan. Tetapi jika Anda ingin mengirim dukungan kopi, Anda dapat mengarahkannya di sini.
Support/Resistance
Volume
- Volume Activity Profiler
- Volume Efficiency Analyzer
- Volume Profile Analytics
- Volume Profile - Updated
- Volume Spread Analysis
- VWAP (Volume Weighted Average Price)
Moving Averages
- SSL Channel
- Anchored Moving Average
- Deviation-Scaled Moving Average
- Gann High Low Activator
- Instantaneous Trendline
- Kaufman Adaptive MA with Trend Vision
- Moving Average Channel
- Moving Averages Suite
- Trend Channel Moving Average
Utilities/Custom
Berbasis Regresi
Volatilitas
Osilator
__________________________________________________________________________________________
PENAFIAN
Perdagangan melibatkan risiko. Indikator ini dimaksudkan hanya untuk analisis teknikal — selalu terapkan manajemen risiko yang tepat dan berdagang dengan bertanggung jawab.
MASUKAN & PENINGKATAN
Jika Anda memiliki saran, permintaan fitur, atau ide untuk peningkatan, silakan tinggalkan komentar di tab Diskusi. Masukan Anda membantu meningkatkan indikator untuk semua orang.
Ringkasan
Key functionalities include identifying trend phases—strong uptrends, downtrends, consolidation, and transition zones—by observing BOP behavior relative to the zero line. It also aids in detecting support and resistance confluence, with extreme BOP readings indicating potential exhaustion near key levels and divergences signaling possible rejections or breakthroughs. The indicator helps identify distribution and accumulation phases through price and BOP divergences.
BOP supports multi-timeframe analysis: higher timeframes provide directional bias, while lower timeframes offer entry timing signals via BOP and signal line crossovers and histogram momentum confirmation. The signal line is a moving average of BOP, with crossovers serving as filtered entry/exit triggers. The histogram can display either BOP polarity or the difference between BOP and its signal line, offering early momentum shift warnings.
Adjustable parameters include smoothing periods and types for both BOP and signal lines, and histogram display modes. The indicator is applicable across Forex, indices, commodities, cryptocurrencies, and stocks markets.


![Logo "[Stellar Strategies] Smart ADX"](https://cdn.ctrader.com/image/webp/af13b084-b6f6-41db-b7bc-c7e688b57b05_36929)


