
KDJ
Wskaźnik
255 pobrania
Wersja 1.0, Dec 2024
Windows, Mac
5.0
Opinie: 1
Opis
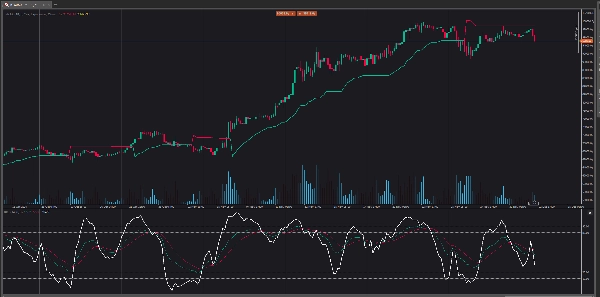
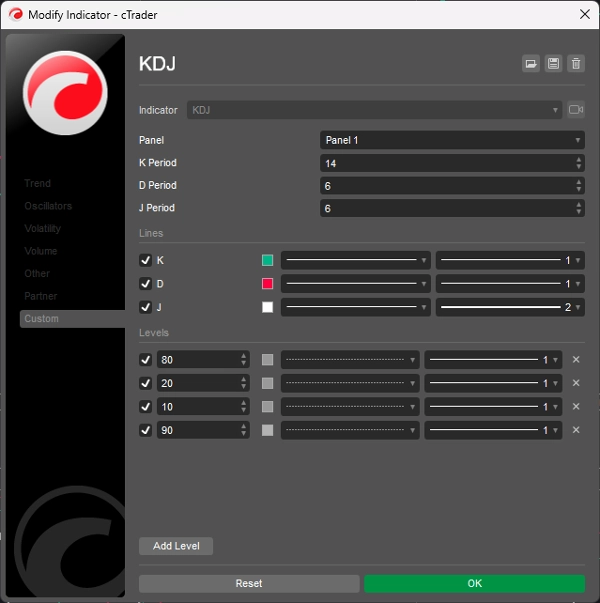
Wyświetlacz oscylatora KDJ składa się z 3 linii (K, D i J - stąd nazwa wyświetlacza) oraz 2 poziomów. K i D to te same linie, co przy użyciu oscylatora stochastycznego. Linia J reprezentuje odchylenie wartości D od wartości K. Zbieżność tych linii wskazuje na nowe możliwości handlowe. Podobnie jak w oscylatorze stochastycznym, poziomy wyprzedania i wykupienia odpowiadają momentom, gdy trend prawdopodobnie się odwróci.
Podsumowanie
Podsumowanie AI
The KDJ indicator is an oscillator consisting of three lines: K, D, and J, along with two reference levels. The K and D lines correspond to those used in the stochastic oscillator, while the J line measures the deviation of the D value from the K value. This convergence of the three lines is used to identify potential new trading opportunities. Similar to the stochastic oscillator, the KDJ indicator highlights overbought and oversold conditions, which often signal possible trend reversals. This tool is designed to assist traders in timing entries and exits by analyzing momentum and trend strength through these oscillating lines.
Profil wskaźnika
Opinie klientów
5.0
Opinie: 1
5 | 100 % | |
4 | 0 % | |
3 | 0 % | |
2 | 0 % | |
1 | 0 % |
Opinie klientów
August 18, 2025
Pros: Three-line stochastic oscillator (K, D, J) that identifies overbought/oversold levels and momentum shifts. Supports divergence analysis and crossovers between K and D as trading signals. Lightweight and responsive. Cons: No alerts, tooltips, or settings presets. J‑line can generate outlier v
Dyskusja
Częste pytania
Produkty dostępne za pośrednictwem cTrader Store, w tym boty handlowe, wskaźniki i wtyczki, dostarczane są przez deweloperów zewnętrznych i udostępniane wyłącznie w celach informacyjnych oraz w celu zapewnienia dostępu technicznego. cTrader Store nie jest brokerem i nie zapewnia doradztwa inwestycyjnego, nie udziela spersonalizowanych rekomendacji ani nie gwarantuje przyszłych wyników.
Więcej od tego autora


![Logo „[Stellar Strategies] Market Session Ultimate”](https://cdn.ctrader.com/image/webp/61ffd537-0125-4246-9e72-42eca1791d64_28232)


Cena
2
Sprzedaż
6.9K
Bezpłatne instalacje