
설명
차이킨 머니 플로우의 주요 목적은 증권의 축적 및 분배 기간을 구분하는 것입니다. 지표가 0선 위에 있을 때는 증권이 순축적 상태임을 나타내며, 이는 투자자들이 자산을 매수하고 있음을 시사합니다.
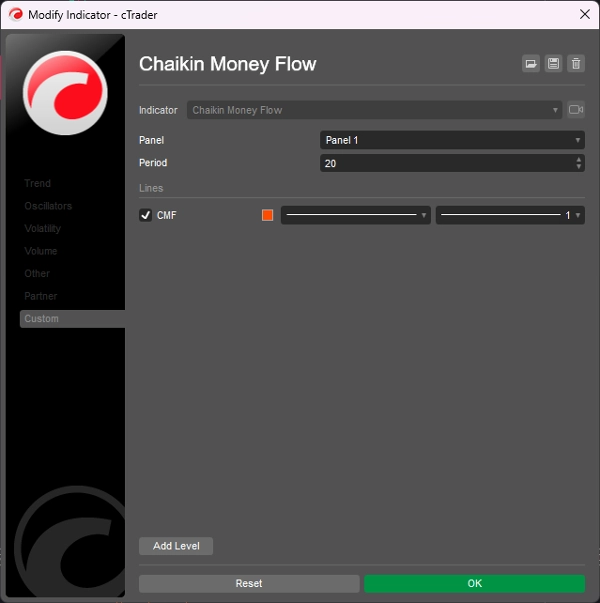
- 값이 30 이상인 차이킨 머니 플로우 설정은 지표의 민감도를 낮춥니다. 이로 인해 신호는 적지만 더 높은 품질의 신호가 생성됩니다.
- 값이 20 이하인 차이킨 머니 플로우 설정은 지표를 과민하게 만듭니다. 이로 인해 시장 잡음이 더 많이 발생합니다.
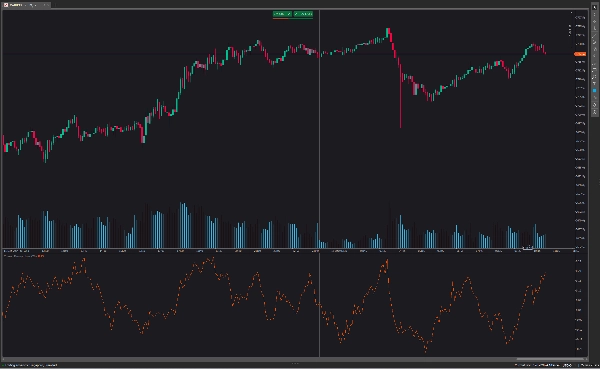
- CMF 지표가 위에서 0선을 교차하고 롱/매수 신호를 생성할 때 지속적인 상승 추세를 나타냅니다.
- CMF 지표가 아래에서 0선을 교차하고 숏/매도 신호를 생성할 때 지속적인 하락 추세를 나타냅니다.
요약
AI 요약
The Chaikin Money Flow (CMF) indicator is designed to identify periods of accumulation and distribution for a security. When the CMF value is above zero, it signals net accumulation, indicating buying pressure. Conversely, values below zero suggest distribution or selling pressure. The indicator’s sensitivity can be adjusted: settings above 30 reduce sensitivity, producing fewer but higher-quality signals, while settings below 20 increase sensitivity, resulting in more market noise. Key signals include a continued uptrend when the CMF crosses the zero line from above, generating buy signals, and a continued downtrend when it crosses from below, generating sell signals. This tool helps traders assess buying and selling momentum to inform trading decisions.
지표 프로필
고객 리뷰
5.0
리뷰: 1
5 | 100 % | |
4 | 0 % | |
3 | 0 % | |
2 | 0 % | |
1 | 0 % |
고객 리뷰
August 18, 2025
Reliable volume-based trend confirmation, easy to read, customizable period. Cons: No alerts, no MTF analysis, limited filtering options.
상담
자주 묻는 질문(FAQ)
트레이딩 봇, 지표, 플러그인 등 cTrader Store에서 제공되는 상품은 제3자 개발자에 의해 제공되며, 이는 단순히 정보 및 기술적 접근을 목적으로 제공된 것입니다. cTrader Store는 중개인이 아니며, 투자 조언, 개인별 추천 또는 향후 성과에 대한 어떠한 보장도 제공하지 않습니다.


가격
2
판매
6.9K
무료 설치