
설명
Opening Price Rays — cTrader 지표
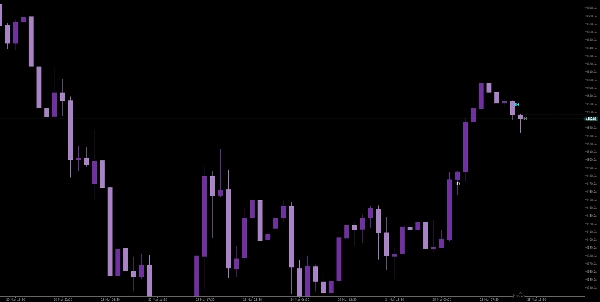
최대 3개의 사용자 지정 가능한 시간대의 시가에서 수평 광선을 차트에 직접 표시합니다. 각 시간대의 캔들이 어디에서 열렸는지 즉시 확인할 수 있어 편향, 진입 및 반응에 대한 주요 참조 수준으로 작용합니다.
주요 사항:
- 3개의 독립적인 시간대 — 각 시간대는 고유한 색상, 선 스타일, 두께 및 레이블 토글을 가집니다. 시각적 혼란을 피하기 위해 완전히 사용자 지정 가능합니다.
- 현재 또는 이전 캔들 — 각 시간대는 현재 캔들의 시가 또는 이전 캔들의 시가를 표시할지 선택할 수 있습니다. 확인된 수준에 유용합니다.
- 광선은 무한대로 확장 — 선은 단순한 짧은 표시가 아니라 전체 차트에 걸쳐 확장되어 줌 수준에 관계없이 수준을 잃지 않습니다.
- 자동 레이블 표시 — 각 광선은 선 시작 부분에 짧은 시간대 태그(예: 1H, 4H, 1D)를 표시하여 빠른 식별이 가능합니다.
- 오버레이 지표 — 별도의 패널 없이 가격 차트에 직접 그립니다.
- 스마트 레이블 형식 — 내부적으로 cTrader의 시간대 이름을 1M, 3H, 1D, 1W, 1MO와 같은 깔끔하고 읽기 쉬운 레이블로 변환합니다.
- 효율적인 렌더링 — 최신 바에서만 재계산하여 불필요하게 과거 데이터를 다시 처리하지 않습니다.
요약
AI 요약
WeOpen is a cTrader indicator that plots horizontal rays from the opening prices of up to three customizable timeframes directly on the price chart. Each timeframe’s opening price is represented by a distinct ray with configurable color, line style, thickness, and optional labeling to minimize visual clutter. Users can select whether to display the opening price of the current or previous candle for each timeframe, allowing for confirmed level analysis. The rays extend infinitely across the chart, ensuring key reference levels remain visible regardless of zoom. Each ray is auto-labeled with a concise timeframe tag (e.g., 1H, 4H, 1D) for quick identification, with smart formatting that converts cTrader’s timeframe names into clear labels such as 1M, 3H, 1W, or 1MO. The indicator overlays directly on the price chart without requiring a separate panel and optimizes performance by recalculating only on the latest bar. It supports various markets including Forex, commodities, indices, stocks, and cryptocurrencies, making it useful for traders seeking to identify bias, entry points, and price reactions based on opening price levels across multiple timeframes.
지표 프로필
고객 리뷰
0.0
리뷰: 0
고객 리뷰
이 상품에 대한 리뷰가 아직 없습니다. 이미 사용해 보셨나요? 다른 사람들에게 가장 먼저 소개해 주세요!
상담
자주 묻는 질문(FAQ)
BTCUSD
Forex
Signal
Breakout
Indices
EURUSD
Commodities
GBPUSD
NZDUSD
Martingale
Prop
Scalping
SMC
Crypto
Grid
Stocks
AI
XAUUSD
NAS100
USDJPY
트레이딩 봇, 지표, 플러그인 등 cTrader Store에서 제공되는 상품은 제3자 개발자에 의해 제공되며, 이는 단순히 정보 및 기술적 접근을 목적으로 제공된 것입니다. cTrader Store는 중개인이 아니며, 투자 조언, 개인별 추천 또는 향후 성과에 대한 어떠한 보장도 제공하지 않습니다.
이 작성자의 상품 더 보기


가격
2.85K
무료 설치