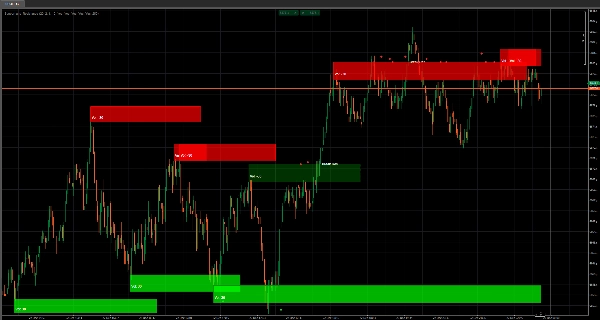
중개인 및 프랍
비즈니스용
00
Days
:
00
Hours
:
00
Minutes
:
00
Seconds
Support and Resistance
지표
1 구매
Version 1.0, Dec 2025
Windows, Mac
가입일 12/03/2025
판매
27
무료 설치
220
"Support and  Resistance" 업로드된 이미지

High-Volume Support & Resistance Boxes — automatically maps real “defend / break” zones
Volume-Weighted Zone Strength (dynamic opacity) — stronger volume = stronger box presence
Pivot-Based Zone Creation (Lookback) — only confirmed levels become zones (less noise)
Adaptive Box Width (ATR-based) — zones scale to current volatility, not fixed guesses
Live Box Extension — zones keep projecting forward as price evolves
Break / Hold Intelligence — detects when a zone holds vs. breaks and instantly reacts
Visual Event Marks (Diamonds) — clean “hold / flip” confirmations without overthinking
Break Labels — clear “Break Sup / Break Res” events on-chart
Full Visual Control — toggles for Boxes / Volume Text / Diamonds / Break Labels
Auto-Clean System — prevents chart clutter by automatically removing old event marks
Max Boxes Control — hard limit to keep performance fast and charts readable

Support & Resistance (High Volume Boxes) is not a basic S/R tool that spits out random lines.
This indicator is built to show you something far more valuable:

Where price created real interest — and where it is most likely to react again.

Instead of drawing “pretty levels,” it builds high-volume supply & demand zones as boxes directly on your chart, so you can trade structure like a professional:
identify the zone → watch the reaction → trade the hold or the break.

The Core Advantage: Volume + Structure, not guessing

Every box is created only when two conditions align:

  1. A confirmed pivot (structure matters)
  2. A volume extreme (interest matters)

That means you’re not getting spammed with weak zones.
You get fewer zones — but the ones you do get are the zones that actually matter.

Strength You Can See (Opacity = Power)

This is where it becomes unfair for people who trade “blind” S/R.
Box fill opacity scales with volume, so you instantly know:

  • Faint box = light interest (watch it)
  • Strong box = heavy interest (respect it)

No extra indicators, no interpretation gymnastics — it’s literally visible.

Volatility-Adaptive Zones (ATR Width)

Markets don’t move the same every day.
This indicator adapts box thickness using a long ATR baseline, so zones expand or tighten with volatility.

Result:
zones stay realistic instead of being too thin to matter or so wide they’re useless.

Hold vs Break Intelligence (and Instant Visual Feedback)

A zone is only valuable if you can read what price is doing with it.

This indicator tracks:

  • Holds (rejection / respect)
  • Breakouts (acceptance through the zone)

…and then updates the styling live:

  • Holds keep the original “support/resistance identity”
  • Breaks flip behavior (support can become resistance and vice versa)
  • Break styling can switch to dashed + new color tone so you know instantly:
    “This level just changed character.”

Diamonds + Break Labels: Clean decision triggers

You get simple, high-signal event markers:

  • Diamonds to highlight hold/flip events
  • Break labels so you never miss the moment a level snaps

It’s the difference between thinking something broke… and knowing it broke.

Built for Real Trading: Control + Clean Charts

This indicator was designed to stay usable after hours of trading:

  • Want only zones? Turn off diamonds/labels.
  • Want pure signals? Turn off volume text.
  • Want performance? Limit Max Boxes.
  • Hate clutter? Auto-Clean Events keeps the chart sharp by removing old marks automatically.

You stay focused on the current battle — not drowned in history.


Recommended Setup (Quick Start)

Lookback Period: 20 (balanced confirmation)
Vol Filter Length: 2 (responsive)
Box Width Mult: 1.0 (neutral)
Show Boxes: ON
Diamonds + Break Labels: ON (until you learn the behavior, then refine)
Auto-Clean Events: ON (keep it clean)


What this indicator really gives you

A visual map of where the market showed its hand — and a live read on whether price is respecting that zone or destroying it.

If you trade breakouts, pullbacks, reversals, or retests:
this becomes your “battlefield overlay.”

0.0
리뷰: 0
고객 리뷰
이 상품에 대한 리뷰가 아직 없습니다. 이미 사용해 보셨나요? 다른 사람들에게 가장 먼저 소개해 주세요!
NAS100
NZDUSD
Martingale
Forex
Fibonacci
EURUSD
MACD
BTCUSD
SMC
Indices
ATR
Stocks
Grid
RSI
Breakout
XAUUSD
FVG
Commodities
Signal
Bollinger
GBPUSD
AI
VWAP
ZigZag
Prop
Supertrend
Crypto
USDJPY
Scalping

이 작성자의 상품 더 보기

지표
Grid
NAS100
RSI
+19
Know sure thing
Know Sure Thing (KST) momentum engine
지표
Grid
RSI
Breakout
+19
Buy and sell indicator
Buy and Sell Signals
지표
NAS100
NZDUSD
Martingale
+26
RollingZSoreTrend V1
Rolling Z-Score Trend, A clean, statistical trend & momentum indicator
지표
Grid
Breakout
Martingale
+4
Coloring Trendline with arrows
Coloring trendline/ Colored Trendline / Color Trendline
지표
NAS100
NZDUSD
Martingale
+22
ALGO-XL KST HeatPulse Pro
A modern Know Sure Thing (KST) momentum oscillator with ALGO-XL style heat visualization, clean signals.
지표
NAS100
NZDUSD
Martingale
+26
overbought oversold
Overbought Oversold Indicator
지표
NAS100
NZDUSD
Martingale
+26
MACD ColorFlow Moving Average v1
MACD ColorFlow Moving Average, A clean, visual trend line driven by MACD momentum.
지표
NAS100
NZDUSD
Martingale
+25
Aggressive Entry Momentum MACD Power Guide
Entry Momentum MACD Power Guide
지표
NAS100
NZDUSD
Martingale
+26
The Professional “All-in-One” Trading Suite
The Professional “All-in-One” Trading Suite (buy and sell indicator)
지표
Grid
XAUUSD
Breakout
+12
heatmap kopie
Dynamic Liquidity Depth exposes hidden volume
지표
Grid
Indices
Breakout
+9
crossover 1
Crossover Buy and Sell Alerts and signals
지표
NAS100
NZDUSD
Martingale
+26
The Market Temperature Moving Average
The "Market Temperature" Moving Average -Turn Your MA Into a Live Market Temperature Line

좋아하실 만한 다른 항목

지표
NAS100
Indices
XAUUSD
+8
Fair Value Gap FVG indicator
Automatically identify and visualize Fair Value Gaps (FVGs) with entry zones, fill tracking, and customizable alerts.
지표
FVG
Fibonacci
Fair Value Gap (Extended)
Detect FVGs with age, status, Fibonacci levels, and customizable fill threshold—extended version.
Range 10 Rsi
RSI Scalping cBot: quick‑fire trades on choppy symbols.
지표
Indices
Prop
Stocks
+3
Levels
Price Action Zone shows previous D/W/M key levels to help frame intraday price action, liquidity, and market structure.
지표
Indices
Prop
Commodities
+3
OBScope
A cutting-edge indicator designed to detect and visualize high-probability zones based on swing highs, swing lows.
지표
Forex
VegaXLR - Chart Patterns Alerts
Enhance your trading strategy with automated detection and alerts for key chart patterns.
지표
NAS100
NZDUSD
XAUUSD
+14
Previous HLOC
Previous HLOC – Smart Higher-Timeframe Levels for Precision Trading.
지표
NAS100
NZDUSD
XAUUSD
+16
Swing AVWAP Pro
Adaptive Swing-Anchored VWAP that tracks market structure shifts with precision and clarity.
지표
Indices
RSI
XAUUSD
+8
MACARX 2026 ULTRA
🚀 MACARX Indicator - The Multi-Indicator Trend Fusion 🚀
지표
Indices
Stocks
Commodities
+2
Instantaneous Trendline
John Ehlers' trendline using signal processing to filter cycle noise and identify trends with minimal lag.
IR Multi Data
show symbol and time fram, daily net profit percent, daily net profit, and spread ln your chart. consider that timezone
지표
Indices
Forex
Signal
+2
Golden Boom And Crash Spike Detector
Golden Boom and Crash Spike Detector is a trading tool designed for Crash 300 and Boom 300 indices on M1 Timeframe.