
Free Smart Money Concepts (SMC) from TradingView
지표
3.28K 다운로드
버전 1.0, Oct 2025
Windows, Mac
5.0
리뷰: 8
설명
- 🔷 스마트 머니 컨셉(SMC)이란?
- SMC는 기관 “스마트 머니”가 포지션을 축적하고 분배하는 방식에 초점을 맞춘 가격 행동 프레임워크입니다.
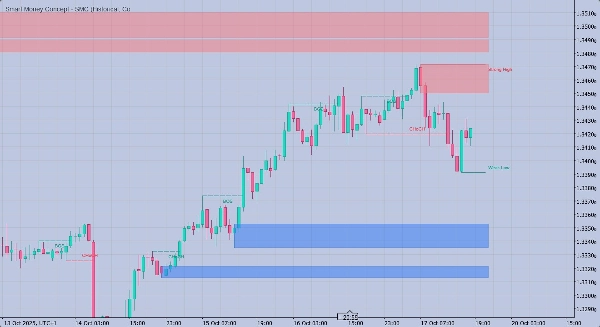
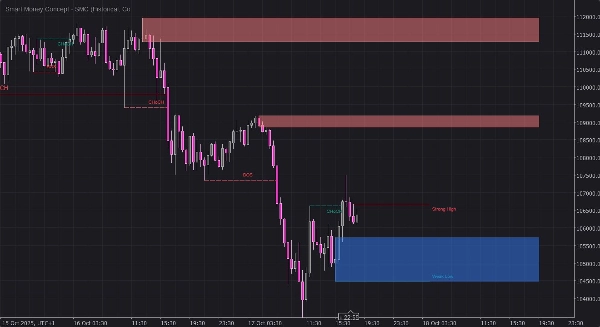
- 기본 패턴을 시장 구조(BOS/CHoCH), 유동성(EQH/EQL), 오더 블록(OB), 공정 가치 갭(FVG), 그리고 프리미엄/디스카운트 존의 논리적 지도와 대체하여 가능한 지속 또는 반전을 예측합니다.
- 🚀 이 지표가 하는 일
- 스윙과 내부 구조 모두에서 구조 붕괴(BOS)와 성격 변화(CHoCH)를 감지합니다.
- 반투명 영역(RGBA 색상—불투명도는 완전 사용자 제어)으로 오더 블록(OB)과 공정 가치 갭(FVG)을 그립니다.
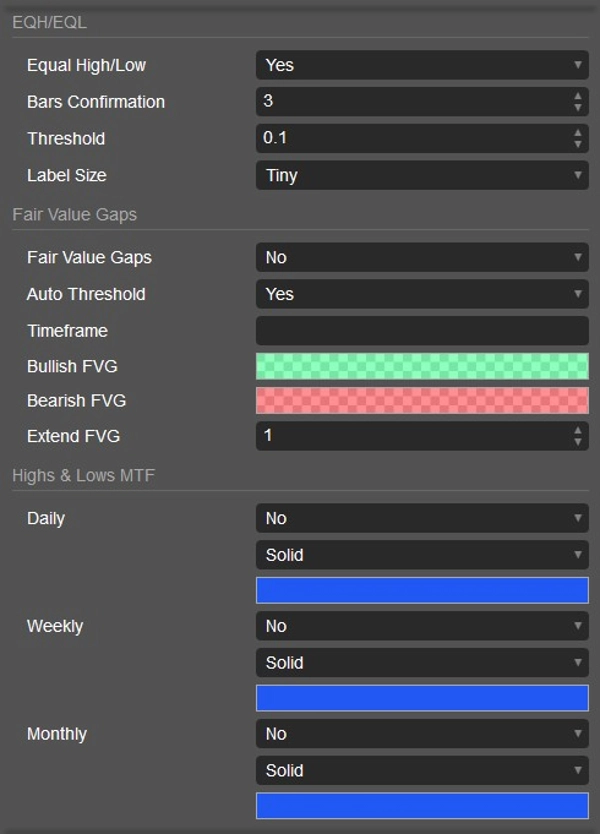
- 유동성 풀을 보여주기 위해 동일 고점/동일 저점(EQH/EQL)을 표시합니다.
- 어느 쪽이 목표가 되거나 보호될 가능성이 있는지 볼 수 있도록 강/약 고점/저점에 라벨을 붙입니다.
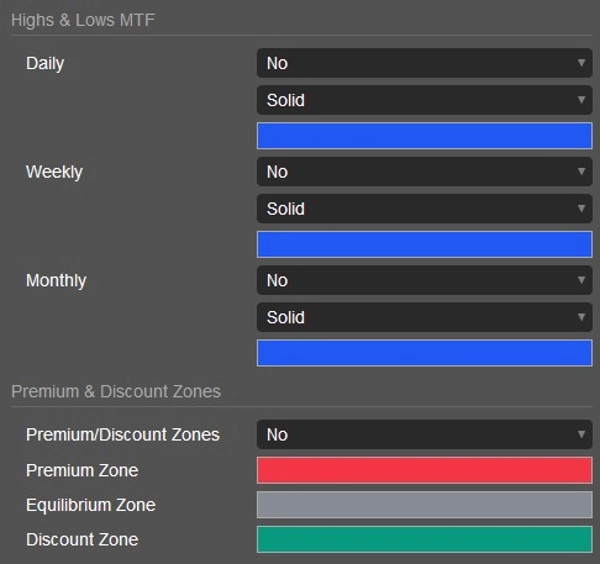
- 현재 스윙 범위 전반에 걸쳐 가치 영역 맥락을 위한 프리미엄/균형/디스카운트 존을 플로팅합니다.
- 다중 타임프레임 일치성을 위해 일간/주간/월간 고점 및 저점을 오버레이합니다.
- 현재/과거 그리기 모드와 단색/컬러 스타일을 제공합니다.
- 🧭 사용 방법 (실용적 워크플로우)
- 1) 먼저 구조를 읽으세요:
-
- 편향을 정립하기 위해 스윙 및 내부 레벨에서 BOS/CHoCH를 찾으세요.
- 강세 BOS + 내부 BOS는 종종 지속 신호이며; CHoCH는 잠재적 반전을 경고합니다.
- 2) 불균형과 블록을 매핑하세요:
-
- 가격이 자주 재조정되는 “효율성 목표”로 FVG를 사용하세요.
- 진입이 형성될 가능성이 있는 완화 구역으로 OB를 사용하세요 (예: 리밋 또는 확인 진입).
- 3) 유동성과 정렬하세요:
-
- 유동성 스윕을 위해 EQH/EQL를 관찰하세요; 스윕 + BOS는 강력한 SMC 내러티브입니다.
- 어느 쪽이 취약한지 판단하기 위해 강/약 고점/저점을 주목하세요.
- 4) 합류를 추가하세요:
-
- 프리미엄/디스카운트를 확인하세요: 디스카운트에서는 매수 세트업이 더 높은 확률이며; 프리미엄에서는 매도 세트업이 더 높습니다.
- 정확성을 위해 MTF 레벨(D/W/M)과 자신의 세션 타이밍을 추가하세요.
- 5) 실행 및 관리:
-
- 진입: 구조 정렬과 함께 OB 완화 또는 FVG 채움.
- 스톱: OB/FVG 무효화 또는 가장 최근 강한 피벗을 넘어서.
- 목표: 반대 유동성, 반대 OB/FVG, 또는 스윙의 균형점.
- ⚙️ 사용자가 제어하는 주요 설정
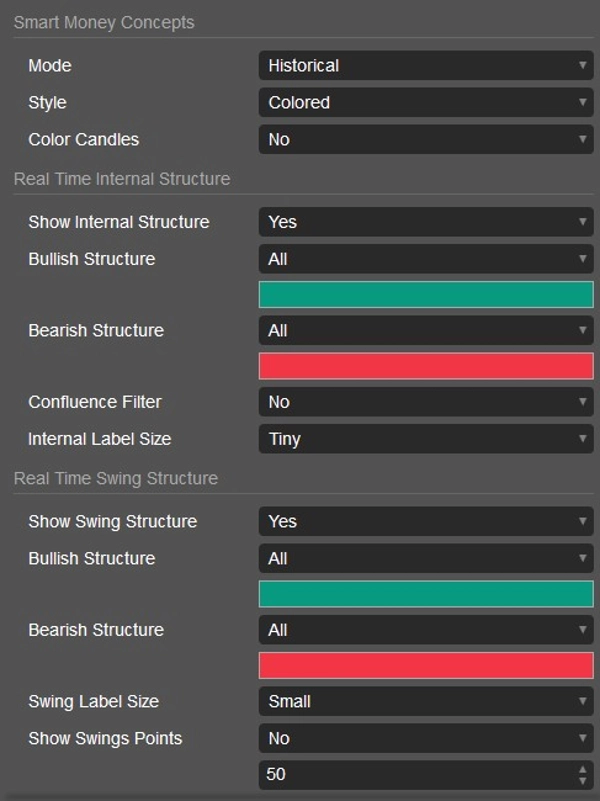
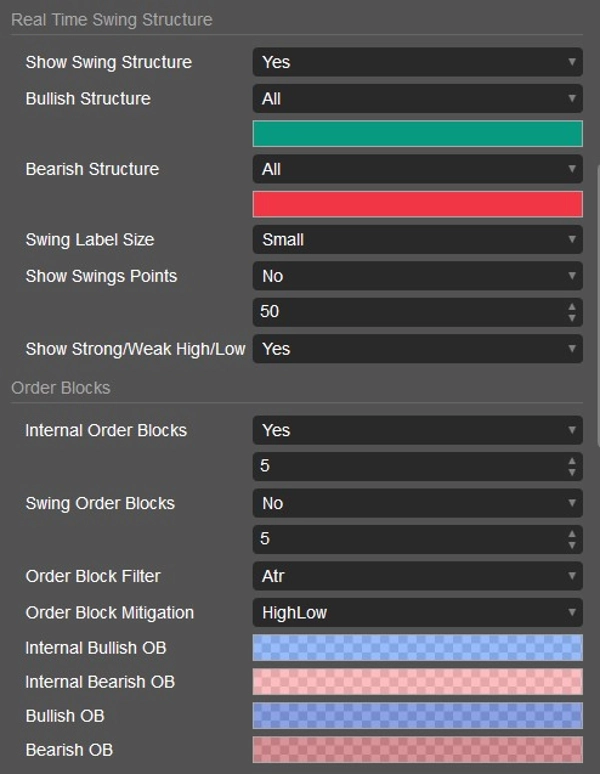
- 모드: 과거 대 현재 (실시간 깔끔한 모습).
- 구조 필터: 스윙 대 내부용 BOS/CHoCH 표시; 라벨 크기; 선택적 합류 (윅 논리).
- OB/FVG 색상: 원하는 RGBA 색상 선택; 알파 채널이 투명도를 직접 설정합니다.
- 개수/한도: 표시 가능한 최대 OB 수; FVG 확장; EQH/EQL 민감도.
- MTF 레벨: 일간/주간/월간 토글 및 선 스타일 선택.
- 스타일: 컬러 또는 단색, 그리고 선택적 추세별 캔들 색상.
- 🧩 트레이더들이 좋아하는 이유
- 1:1 동등 논리로 인기 있는 TradingView SMC 접근법과 일치 (BOS/CHoCH, OB/FVG 동등성).
- 깔끔한 시각화: 존과 라벨이 읽기 쉽고 실시간으로 부드럽게 업데이트됩니다.
- 유연성: 스캘핑부터 스윙 트레이딩까지, cTrader가 지원하는 모든 심볼과 타임프레임에서 작동합니다.
- ✅ 최선의 실천법
- SMC 컨텍스트를 위험 관리 및 명확한 플레이북(진입, 스톱, 목표 규칙)과 결합하세요.
- 고품질 움직임을 위해 HTF 레벨과 세션 오픈 주변에 알림 또는 감시 목록을 사용하세요.
- 무작위 변동성을 피하기 위해 항상 시장 세션과 뉴스 캘린더로 검증하세요.
- 📌 참고 사항
- 시각화는 브로커 데이터(호가 피드/세션이 다를 수 있음)에 따라 달라집니다.
- 이 도구는 재정 조언이 아닙니다; 거래에는 위험이 따릅니다. 실거래 전 데모 계정에서 사용하세요.
요약
AI 요약
Free Smart Money Concepts (SMC) indicator for cTrader replicates the TradingView SMC framework, focusing on institutional price action analysis. It identifies key market structure elements such as Break of Structure (BOS) and Change of Character (CHoCH) on both swing and internal levels to help establish trading bias. The indicator visually marks Order Blocks (OB) and Fair Value Gaps (FVG) as semi-transparent zones, highlighting potential entry and mitigation areas. It also detects Equal Highs/Lows (EQH/EQL) to indicate liquidity pools, and labels strong or weak highs and lows to assess market vulnerability.
Additional features include plotting premium, equilibrium, and discount zones within the current swing range for value-area context, and overlaying daily, weekly, and monthly highs and lows for multi-timeframe confluence. Users can customize drawing modes (present or historical), color schemes (monochrome or colored), and opacity levels for OB/FVG zones. The indicator supports flexible use across all symbols and timeframes available in cTrader, suitable for scalping to swing trading.
The workflow involves reading market structure, mapping imbalances and blocks, aligning with liquidity, adding confluence from premium/discount zones and multi-timeframe levels, and executing trades with defined entry, stop, and target rules. Visuals depend on broker data feeds. This tool is intended for analysis and does not provide financial advice.
지표 프로필
고객 리뷰
5.0
리뷰: 8
5 | 100 % | |
4 | 0 % | |
3 | 0 % | |
2 | 0 % | |
1 | 0 % |
고객 리뷰
July 6, 2026
May 23, 2026
March 4, 2026
December 11, 2025
November 4, 2025
Superfantastic 3 in one zones, one of the best indicators on here ,and for free. If you cant figure it out after this, you got something wrong with ya :). Nicely done my friend, how did you code it C# or python?
상담
자주 묻는 질문(FAQ)
BTCUSD
Forex
Signal
Breakout
Indices
EURUSD
Commodities
GBPUSD
NZDUSD
Fibonacci
Prop
ZigZag
Scalping
Fair Value Gap
SMC
Crypto
Stocks
XAUUSD
NAS100
ATR
USDJPY
트레이딩 봇, 지표, 플러그인 등 cTrader Store에서 제공되는 상품은 제3자 개발자에 의해 제공되며, 이는 단순히 정보 및 기술적 접근을 목적으로 제공된 것입니다. cTrader Store는 중개인이 아니며, 투자 조언, 개인별 추천 또는 향후 성과에 대한 어떠한 보장도 제공하지 않습니다.
이 작성자의 상품 더 보기


가격
46
판매
4K
무료 설치