Descrição
O Índice de Pressão da Vela (CPI) é um indicador poderoso e fácil de usar, projetado para revelar a pressão oculta de compra e venda por trás de cada vela. Em vez de simplesmente mostrar se o preço subiu ou desceu, o CPI aprofunda-se em quão fortemente os compradores ou vendedores controlaram o mercado dentro de cada vela. Isso o torna uma ferramenta única para identificar a força da tendência, detectar reversões precocemente e confirmar pontos de entrada ou saída com maior precisão.
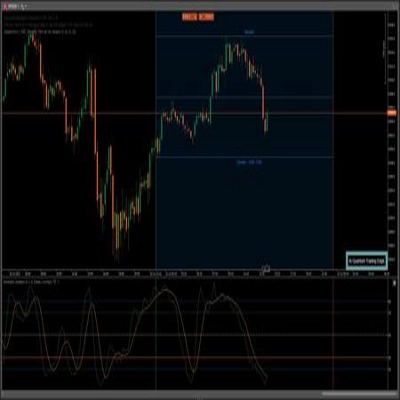
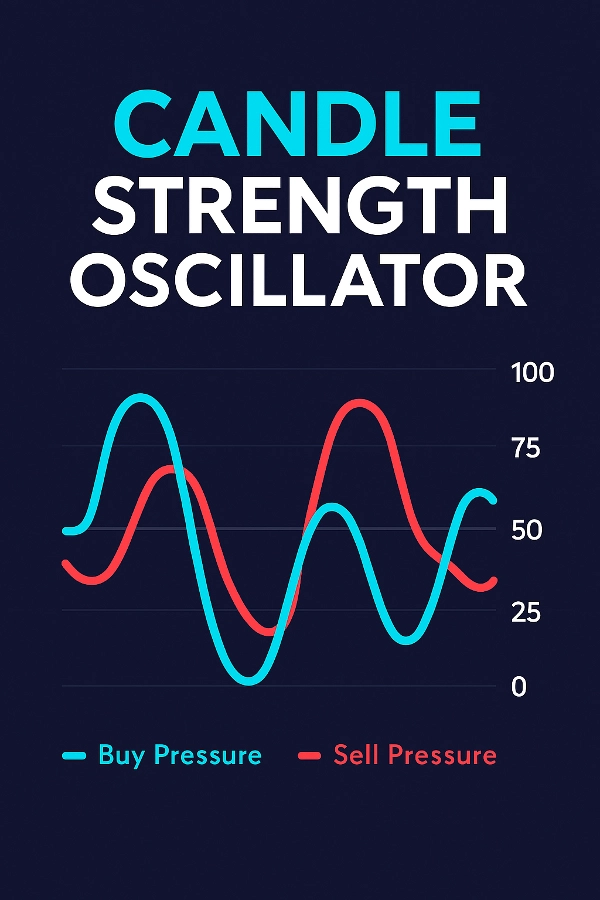
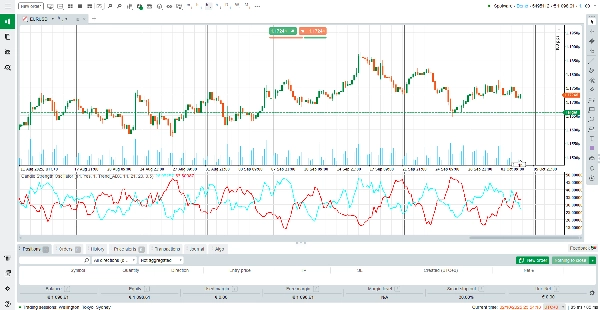
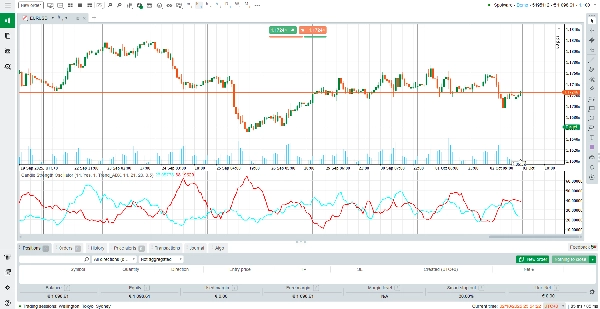
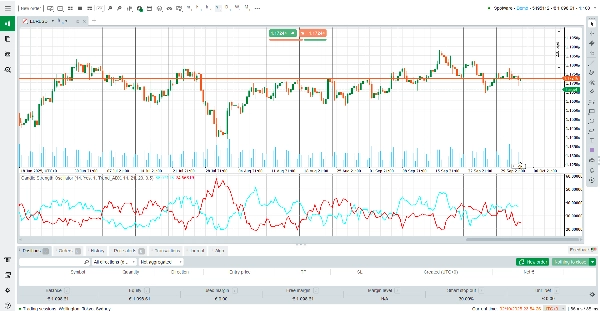
Ao contrário dos osciladores tradicionais que apenas reagem ao preço, o CPI combina a dinâmica do corpo da vela, momentum, ponderação por volume e análise de tendência (ADX ou EMA) para oferecer uma visão abrangente da pressão do mercado. Com duas linhas suaves – Pressão de Compra (ciano) e Pressão de Venda (vermelha) – os traders podem ver instantaneamente qual lado do mercado está no controle.
Como Ler o Indicador
Pressão de Compra (Linha Ciano) – Representa a intensidade do controle altista. Uma linha ascendente mostra domínio crescente dos compradores.
Pressão de Venda (Linha Vermelha) – Representa a intensidade do controle baixista. Uma linha ascendente mostra força de venda mais forte.
Cruzamentos – Quando a linha de Compra cruza acima da linha de Venda, sinaliza pressão altista mais forte (potencial oportunidade de compra). Quando a linha de Venda cruza acima, a pressão baixista domina (potencial oportunidade de venda).
Zona do Nível 50 – Leituras próximas ao meio (≈50) indicam equilíbrio entre compradores e vendedores, enquanto leituras extremas (acima de 75 ou abaixo de 25) mostram pressão direcional forte.
Impulso do Fator de Tendência – O indicador adapta seus sinais com base na confirmação da tendência pelo ADX ou inclinação da EMA, reduzindo sinais falsos durante mercados laterais.
Como o Indicador Funciona
O CPI calcula a pressão usando um modelo ponderado que considera:
Estrutura da vela: O tamanho do corpo e a posição do fechamento em relação à máxima/mínima.
Momentum: Movimento do preço comparado à vela anterior.
Volume: A ponderação pelo volume de ticks garante que movimentos de alto volume tenham mais significado.
Confirmação de tendência: A força do ADX ou a inclinação da EMA adicionam um fator de impulso para alinhar os sinais com a tendência predominante.
Suavização: Um filtro SMA definido pelo usuário garante linhas suaves e estáveis sem perder a capacidade de resposta.
Esta fórmula avançada significa que o CPI não apenas reage ao preço, mas também entende por que o preço está se movendo – dando aos traders uma visão mais profunda do comportamento do mercado.
Principais Características
Visualização de Duas Linhas – Compare instantaneamente a pressão de compra versus venda com linhas codificadas por cores (ciano para compradores, vermelho para vendedores).
Impulso Adaptativo de Tendência – Integra ADX ou EMA para confirmar a direção da tendência e reduzir sinais falsos.
Cálculo Sensível ao Volume – Ponderado pelo volume de ticks para destacar movimentos respaldados pela participação real do mercado.
Exibição Suave e Limpa – Filtro SMA embutido para leituras suaves sem distorções lentas.
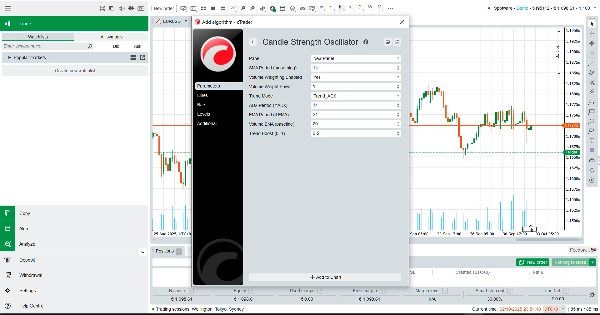
Totalmente Personalizável – Períodos ajustáveis, ponderação e intensidade do impulso para combinar com qualquer estilo de negociação.
Por Que Usar o Índice de Pressão da Vela?
O CPI é perfeito para traders que querem ir além da simples ação do preço e ver a verdadeira batalha entre compradores e vendedores. Seja você um scalper, trader de swing ou seguidor de tendência, este indicador gratuito oferece a clareza necessária para cronometrar entradas, gerenciar riscos e manter-se alinhado com a direção real do mercado.
Baixe o Índice de Pressão da Vela (CPI) hoje – e negocie com confiança entendendo as forças ocultas que movem cada vela.
Resumo
The indicator displays two smooth lines: Buy Pressure (cyan) and Sell Pressure (red). Crossovers between these lines signal shifts in market dominance, helping traders identify trend strength, potential reversals, and optimal entry or exit points. Readings near the midpoint indicate balance, while extremes suggest strong directional pressure.
CPI incorporates volume-weighted calculations and trend-based boosts to reduce false signals during sideways markets. It includes a smoothing filter for stable, responsive readings and offers customization of periods, weighting, and trend boost intensity.
This tool is applicable across various markets including Forex, commodities, stocks, and cryptocurrencies, supporting trading strategies such as scalping and breakout trading. It aims to provide traders with enhanced insight into market dynamics beyond simple price action.
Avaliações de clientes
5 | 0 % | |
4 | 100 % | |
3 | 0 % | |
2 | 0 % | |
1 | 0 % |