
Description
Supreme Power House reads market structure, grades every signal against seven filters and draws a
complete trade plan for each one. It marks a buy or a sell when a candle closes beyond the latest swing
high or swing low: a change of character (CHoCH) when the break turns the structure, a break of
structure (BOS) when it continues it. Each signal comes with an entry, a stop, up to three targets and a
grade from A to C, with an adaptive trend ribbon, ICT zones and a dashboard of six timeframes around it.
WHAT IT DRAWS
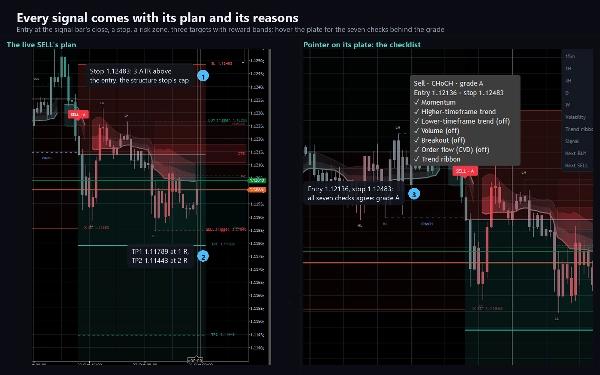
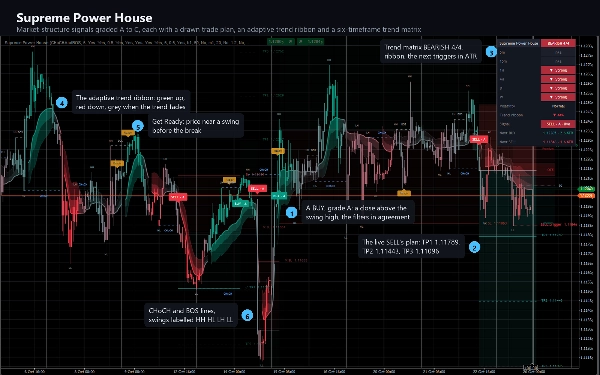
- BUY and SELL plates on the signal bar, graded A, B or C. Hover a plate for its checklist: the kind of
break, the entry, the stop and which of the seven filters agree.
- The trade plan of every signal: an entry line, a stop line with its label, a shaded risk zone, one
reward band per target and a dashed line for each target, labelled with its price. A reached target
gets a tick; a stop that is reached gets a cross.
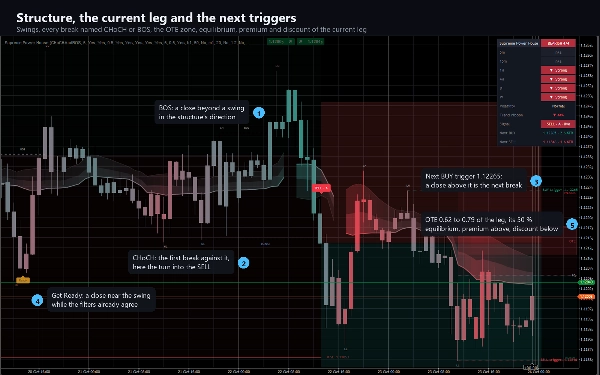
- Structure: dashed CHoCH and BOS lines from the broken swing to the bar that broke it, and HH, HL, LH
and LL labels on every confirmed pivot.
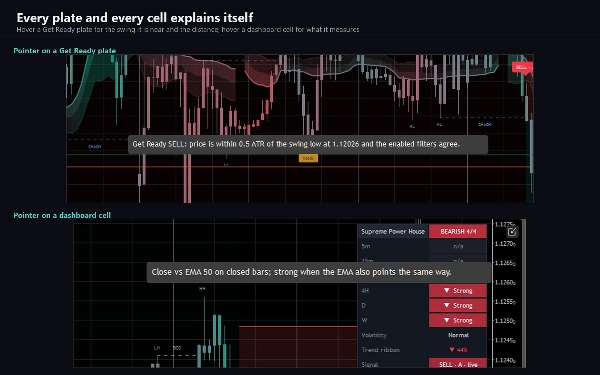
- Get Ready plates when price comes within half an ATR of an unbroken swing while the filters already
agree, before the signal itself.
- Next BUY and SELL triggers: dotted lines at the swing high and swing low that the next signal needs a
close beyond, labelled with their prices.
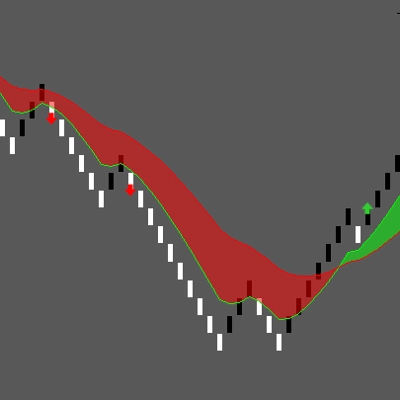
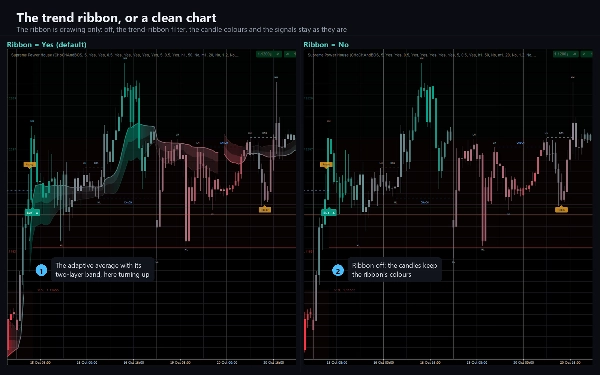
- The adaptive trend ribbon: a Kaufman-style moving average with a two-layer band whose colour runs from
red through grey to green with the strength of the trend, and candles coloured to match.
- ICT zones of the current leg: the optimal trade entry (OTE) zone from 62 to 79 percent, the
equilibrium line at 50 percent, and premium and discount shading.
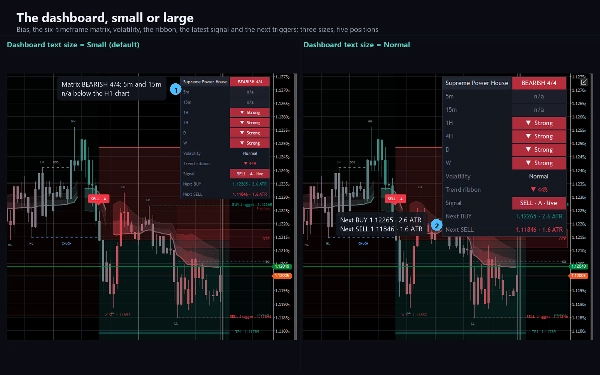
- A dashboard: the trend of six timeframes from 5 minutes to weekly, each rated strong or weak, the
overall bias, volatility, the ribbon's direction and conviction, the state of the latest signal and
the distance to the next trigger in ATR. Hover a cell for an explanation.
HOW IT DECIDES
Swings are pivots with five bars on each side. A signal needs a candle to close beyond the latest
unbroken swing, and every enabled filter must agree. Three filters are on by default: momentum (the
close against the close five bars before, at least half an ATR), the higher-timeframe trend (the close
against a 50-period EMA on the one-hour chart, closed bars only) and the trend ribbon. Four more can be
switched on: the lower-timeframe trend, relative volume, a break of the recent range and order flow,
which is the cumulative volume delta read from lower-timeframe bars. A session window with its own
timezone is optional too. One signal per direction is printed until the opposite one.
The grade counts all seven checks, enabled or not: five or more in agreement is grade A, three or four
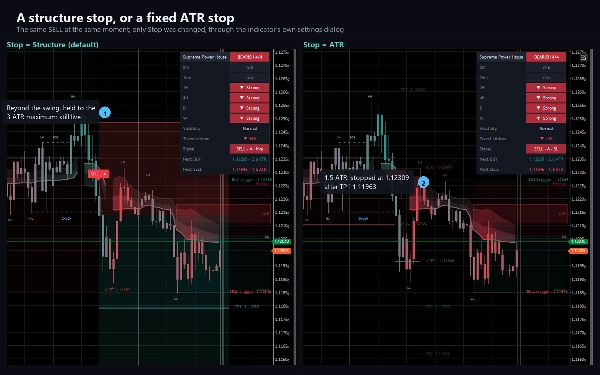
is B, fewer is C. The stop sits beyond the swing the move started from, plus a tenth of an ATR, and is
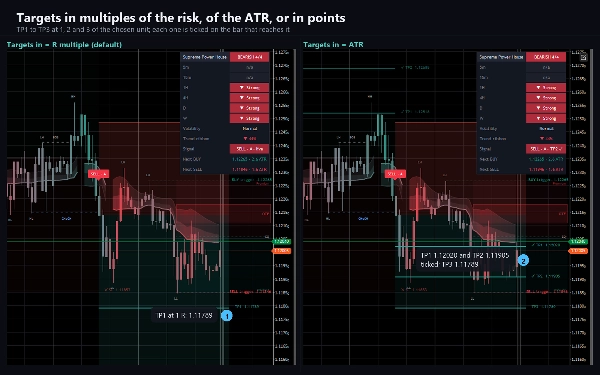
kept between half an ATR and three ATR; a plain ATR multiple can be used instead. Targets are one, two
and three times the risk by default, or ATR multiples, or fixed price distances. The plan checks the
stop first and then the targets, bar by bar, and ends at the stop, at the last target or at the next
signal.
Everything is decided when a bar closes: a signal, its grade and its plan never change once printed.
The ribbon, the candle colours and the dashboard follow the forming bar.
KEY SETTINGS
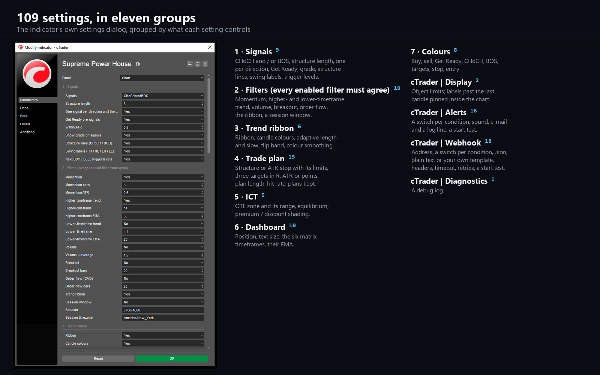
109 settings in eleven sections: signals and structure, the seven filters, the trend ribbon, the trade
plan, the ICT zones, the dashboard and its six timeframes, colours, and groups for display, alerts,
the webhook and diagnostics.
ALERTS AND WEBHOOK
Eight conditions, each with its own switch: a BUY or a SELL signal, a Get Ready in either direction,
each of the three targets reached, and the stop reached. Each arrives as a log line, a sound of your choice
and e-mail, and a test on start checks your settings without waiting for a signal. Nothing fires while
the indicator walks the chart's history, and nothing fires in a backtest.
A webhook posts the same eight conditions, each with its own switch, to any address you enter: a chat
bot, a journal, an automation flow or your own server. Choose a JSON body with the bar, the direction,
the grade, the kind of break, the entry, the stop, the three targets, the risk and the checklist, the
plain alert sentence, or your own template with 22 placeholders. Add an access key header
and one more header of your own. A post that gets no success answer is sent again, and a test on start
checks the address. It stays off until you enter one, is sent once per condition per bar, is capped at
twenty messages a minute, and a failure is logged rather than thrown. It sends through cTrader's own
networking service, which is why the indicator needs no file or network access rights at all.
TYPE AND WINDOW
An overlay indicator: everything is drawn on the price chart, and it adds no separate pane. cTrader
leaves little room past the last bar, so the trigger labels, the zones and the target labels placed
after it are pinned inside the chart by default while the last bar is in view; one switch places them
at their designed spot.
TIMEFRAMES AND INSTRUMENTS
Any timeframe from one minute to daily and any instrument: forex pairs, metals, indices and crypto. The
higher-timeframe filter and the dashboard read the chart's own symbol on the other timeframes, loaded in
the background, and prices are written to your broker's own tick. When it attaches, the indicator loads
at least 5,000 bars of the chart's history.
USE CASES
- Trading breaks of structure and changes of character with the plan drawn for each signal.
- Keeping only signals that agree with the higher-timeframe trend and the trend ribbon, and reading the
grade at a glance.
- Preparing for the next signal with the Get Ready plates and the trigger lines.
- Timing entries in the OTE zone and reading premium and discount.
- Checking six timeframes at once on the dashboard.
- Being told by log line, sound, e-mail or webhook when a signal prints or a target or the stop is
reached.
WHO IT IS FOR
Traders who work with market structure, smart money concepts and ICT zones, and want their signals found,
graded and planned by fixed rules rather than drawn by hand.
TECHNICAL NOTES AND LIMITATIONS
Access rights: none. The indicator cannot read files, start processes or open connections of its own.
It is a charting and analysis tool. It does not place orders and it has no access to your account.
The filters and the dashboard use your broker's prices and tick volume, so another feed can grade or
time a signal differently. An optional statistic on the target labels counts how often the chart's closed
plans reached each target; it describes the chart's past and is not a win probability. By default the
chart keeps the newest 500 boxes, 500 lines and 500 labels, so the oldest drawings retire on a long
chart; a switch keeps all of them.
SUPPORT
Questions go through the Discussion tab. Include your broker, symbol, timeframe, cTrader version and
a screenshot of the full chart, and you will get a useful answer first time.
Trading involves risk. Past performance does not guarantee future results.
Summary
The indicator overlays buy and sell signals directly on the price chart, displaying graded plates with checklists, dashed lines for structural breaks, swing highs/lows, and labels for pivots (HH, HL, LH, LL). It includes an adaptive trend ribbon that visually represents trend strength and direction, ICT zones for optimal trade entries, and a dashboard summarizing trend and volatility across six timeframes from 5 minutes to weekly.
Supreme Power House supports alerts and webhook notifications for signals, targets, and stops, configurable with custom messages and headers. It operates without requiring special access rights, does not place orders, and uses broker price and volume data. The tool suits traders employing market structure, smart money concepts, and ICT zones who prefer systematic signal grading and trade planning.
Discussion
Customer reviews
5 | 100 % | |
4 | 0 % | |
3 | 0 % | |
2 | 0 % | |
1 | 0 % |