
Volume-Powered Market Flow Projector
指标
255 下载
版本 1.0, Jul 2025
Windows 版、Mac 版
5.0
评价:1
说明
Pinescriptlabs 商店指标: Pinescriptlabs 商店 cBots : (cBot) Gold & BTC 突破会话枢轴(新)
高级市场结构:Bos,Choch,SwinLevels,订单区块, 市场结构与流动性发现器(新)
智能追踪算法 (新)
📊 市场流动投影:
该 FutureTrend 指标旨在通过整合多个时间维度的价格和成交量数据,动态分析和预测市场行为。其主要功能包括:
⏳ 三周期分析
📈 计算由 周期 参数定义的三个连续周期内的平均价格(高点和低点)及成交量差(买卖压力差异)。
🔍 这种历史走势的综合视图有助于识别主导趋势和市场行为的变化。
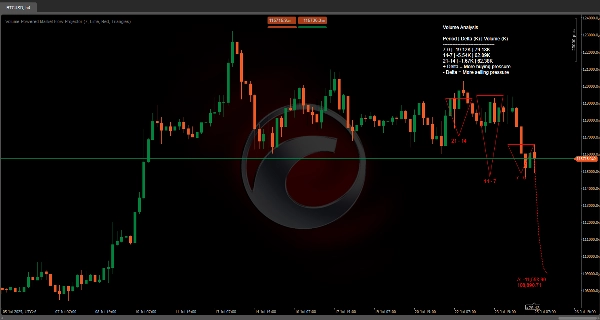
🚀 未来趋势线投影
📊 利用三个分析周期的成交量差加权平均,该指标投影出反映市场可能方向的 未来趋势线。
🛠️ 该投影通过平滑因子动态调整,以避免极端预测。
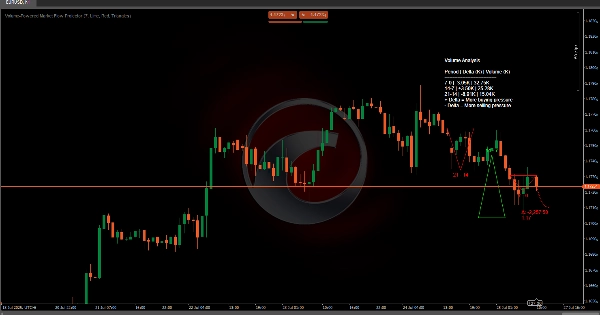
🔷 形状的视觉表现
🎨 历史数据通过 几何形状(三角形、圆形或方框)直观展示每个周期的成交量和价格范围演变。
🔴🟢 分配的颜色(上涨色 和 下跌色)表示主导趋势(看涨或看跌),便于快速解读。
🏷️ 平均成交量差及未来价格标签
📍 在预测趋势线的末端,显示一个 标签,展示平均成交量差和估计的未来价格,为潜在价格变动和趋势强度提供关键参考。
📋 成交量数据表
📑 提供详细的 表格,分解三个分析周期的总成交量和成交量差异。
📊 这使交易者能够快速比较成交量数据,解读市场背景,并支持未来趋势投影。
🔮 方向
通过结合 成交量 和 价格数据,该指标提供了一个强大的工具,用于预测趋势强度和未来周期中市场行为的潜在变化。
摘要
AI 摘要
The Volume-Powered Market Flow Projector is an indicator designed to analyze and project market behavior by integrating price and volume data across multiple timeframes. It performs a three-period analysis, calculating average highs, lows, and delta volume (the difference between buying and selling pressure) over three consecutive periods defined by a user-set parameter. This approach helps identify dominant trends and shifts in market dynamics.
The indicator projects a future trendline based on a weighted average of delta volumes from the analyzed periods, dynamically adjusted with smoothing factors to prevent extreme predictions. Historical data is visually represented using geometric shapes—such as triangles, circles, or boxes—that illustrate volume and price range evolution for each period. Colors indicate prevailing trends, with distinct hues for bullish and bearish conditions.
At the end of the projected trendline, a label displays the average delta volume and estimated future price, providing a reference for potential price movements and trend strength. Additionally, a detailed volume data table breaks down total volumes and delta differences for the three periods, supporting market context interpretation and trend projection. By combining volume and price data, this tool aids in predicting trend strength and potential market behavior shifts.
指标配置
客户评价
5.0
评价:1
5 | 100 % | |
4 | 0 % | |
3 | 0 % | |
2 | 0 % | |
1 | 0 % |
客户评价
August 2, 2025
Interesting indicator. Is it possible to position the text on the right or left side, with the option to change the positioning? Use a textblock, for example. it's not exactly the best as a current positioning https://prnt.sc/lUOx9FhSSnSJ
讨论
常见问答
cTrader Store 提供的所有产品,包括交易机器人、指标和插件,均由第三方开发者提供,仅供信息参考和技术访问之用。cTrader Store 并非经纪商,不提供投资建议、个人推荐或任何未来业绩保证。


价格
注册日期 03/10/2024
163
销售
39.1K
免费安装