
说明
VmmSignalAverage PRO 试用版是一款综合交易指标,将多种技术分析系统融合为一个强大的工具。它能够检测关键图表形态,并提供清晰的视觉信号,帮助做出更好的交易决策。
主要特点:
12 移动平均类型:包括(中位数)、SMA、EMA、双重 EMA、三重 EMA、Hull、时间序列、三角形、VIDYA、加权、Wilder 平滑、Kaufman 自适应
基于 ATR 的信号系统:使用平均真实波幅进行动态距离计算
6 种形态检测系统:
公平价值缺口(FVG),颜色可自定义
价格缺口识别
内包线形态
Reverse123 反转信号
带可配置比例的影线形态
趋势方向箭头
智能趋势过滤器:仅显示趋势方向的信号
性能优化:内置缓存系统,运行流畅
自动清理:保持图表整洁有序
使用方法:
基本设置:
将指标添加到您的图表中
配置移动平均类型和周期
根据需要启用/禁用形态检测
交易信号:
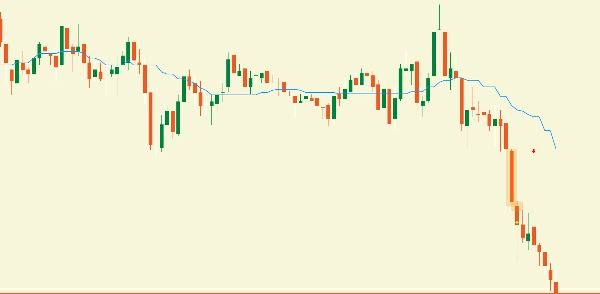
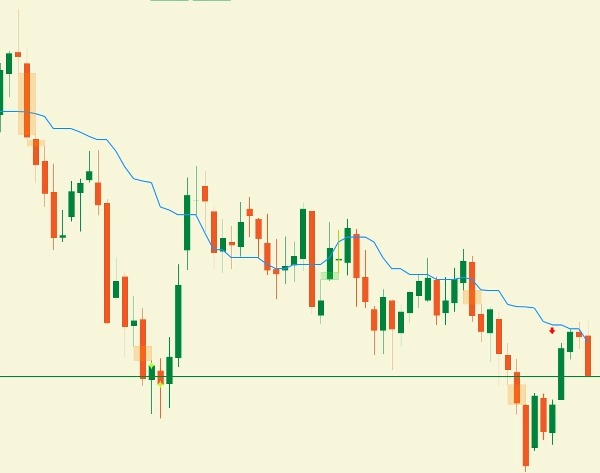
看涨信号:在看涨趋势中出现(绿色圆圈/星形)
看跌信号:在看跌趋势中出现(红色圆圈/星形)
FVG 区域:高亮显示不平衡区域的矩形
缺口:用彩色矩形标记
内包线:以可自定义颜色显示
参数配置:
移动平均组:
计算类型:从12种移动平均类型中选择
周期:移动平均周期(3-100)
价格类型:计算所用的价格来源
中位数智能价格:用于中位数计算的智能价格选择
趋势设置:
显示趋势箭头:显示趋势方向箭头
前几根柱子检查:分析趋势的柱子数量
严格趋势检测:使用严格或宽松的趋势规则
趋势过滤器:0=显示所有信号,1=仅显示顺势信号
形态组(FVG、GAP、INSIDEBAR、Reverse123、Wick):
启用/禁用:切换每种形态类型
颜色:自定义看涨/看跌颜色
透明度:控制形态高亮的透明度
尺寸阈值:形态最小尺寸(点数)
ATR 乘数:基于市场波动性的动态距离
ATR 设置:
ATR 周期:用于平均真实波幅计算的相同期数
使用 ATR:启用基于波动性的动态距离
ATR 乘数:调整不同形态的灵敏度
图表清理:
保留最后几根柱子:显示的历史柱子数量
自动清理图表:自动清理旧对象
性能优势:
优化的计算系统减少 CPU 使用率
智能缓存防止重复计算
自动清理保持图表性能
可配置的性能日志以便监控
推荐设置:
日内交易:周期20,严格趋势 = false
波段交易:周期50,严格趋势 = true
剥头皮交易:周期10,严格趋势 = false
支持:
如有问题或需要支持,请参考指标设置或通过 cTrader 商店联系。
注意:这是一个技术分析工具。请始终使用适当的风险管理,并结合其他分析方法进行交易决策。
标签:形态识别,技术分析,交易信号,移动平均,ATR,FVG,价格行为,图表形态,交易指标,专业工具
***** 试用版中禁用的功能 *****
FVG(公平价值缺口):禁用(TRIAL_SHOW_FVG = false)
Reverse 123 形态:禁用(TRIAL_SHOW_REVERSE123 = false)
影线形态的 ATR:禁用(TRIAL_USE_ATRWick = false)
移动平均类型:仅限 SMA
周期灵活性:固定为 21
历史分析:固定为 3 根柱子
摘要
Users can customize moving average types, periods, price sources, and pattern detection settings including colors, opacity, and size thresholds. The ATR settings enable dynamic distance calculations based on volatility, enhancing signal accuracy. The tool features automatic chart cleanup to maintain clarity and optimized performance through caching and reduced CPU usage.
Trading signals are visually represented with bullish (green) and bearish (red) markers, along with highlighted pattern zones. Recommended configurations are provided for day trading, swing trading, and scalping. This indicator serves as a comprehensive pattern recognition and signal tool to assist in informed trading decisions when combined with proper risk management.
客户评价
5 | 100 % | |
4 | 0 % | |
3 | 0 % | |
2 | 0 % | |
1 | 0 % |


!["Smart Money Concepts (SMC) [Iridio Capital]" 标识](https://cdn.ctrader.com/image/webp/28b69fd1-ef54-4bed-9487-07e78e883be4_40934)