
Breakout channel
อินดิเคเตอร์
524 ดาวน์โหลด
เวอร์ชัน 1.0, Nov 2025
Windows, Mac
คำอธิบาย
ช่องเบรกเอาต์
สิ่งที่มันทำ
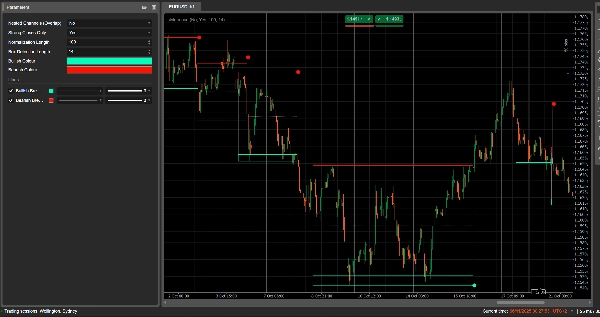
ช่องเบรกเอาต์ ตรวจจับช่วงการรวมตัวโดยอัตโนมัติ (กล่องราคา) และทำเครื่องหมาย จุดเบรกเอาต์ เมื่อราคาหลุดออกจากช่วงเหล่านั้น
มันวาด:
- กล่องช่องสี เทา รอบโซนการรวมตัว
- แถบบนสี แดง (แนวต้านที่เป็นไปได้)
- แถบล่างสี เขียว (แนวรับที่เป็นไปได้)
- เส้นกลางประสีขาว จุด (จุดกึ่งกลางช่อง)
- จุดสี เมื่อเกิดเบรกเอาต์:
-
- จุดสีเขียว/ฟ้าใต้กล่อง → เบรกเอาต์ขาขึ้น
- จุดสีแดงเหนือกล่อง → เบรกเอาต์ขาลง
แนวคิดคือการเน้นพื้นที่ที่ราคากำลังเคลื่อนตัวเป็นวงกลมและที่ที่การเคลื่อนไหวที่แข็งแกร่งมีแนวโน้มจะเริ่มต้นเมื่อช่วงเวลาหลุดออก
วิธีการคำนวณ
- การทำให้ราคาปกติ
-
- ในช่วง Normalization Length แท่งเทียนล่าสุด มันจะหาค่า สูงสุดสูง และ ต่ำสุดต่ำ.
- มันทำการปรับค่าปิดให้อยู่ในช่วง 0–1:
normalizedPrice=Close−LowestLowHighestHigh−LowestLow\text{normalizedPrice} = \frac{\text{Close} - \text{LowestLow}}{\text{HighestHigh} - \text{LowestLow}}normalizedPrice=HighestHigh−LowestLowClose−LowestLow
- การวัดความผันผวน
-
- มันคำนวณ ส่วนเบี่ยงเบนมาตรฐาน ของราคาที่ทำให้เป็นปกติในช่วง 14 แท่งเทียน
- ซึ่งให้ชุดข้อมูลความผันผวนที่ใช้ตรวจจับจุดเปลี่ยนในโครงสร้างตลาด
- เส้นความผันผวน “บน / ล่าง”
-
- ในช่วง (Box Detection Length + 1) แท่งเทียนล่าสุด มันจะหาค่า:
-
- แท่งเทียนที่ความผันผวน สูงสุด
- แท่งเทียนที่ความผันผวน ต่ำสุด
- จากจำนวนแท่งเทียนย้อนหลังที่เกิดค่าสูงสุดและต่ำสุดนี้ มันสร้างเส้นสังเคราะห์สองเส้น: บน และ ล่าง.
- การตัดกันระหว่างเส้นเหล่านี้สัญญาณถึง จุดเริ่มต้น/สิ้นสุดที่เป็นไปได้ของช่วงช่อง.
- การเริ่มต้นและระยะเวลาของช่อง
-
- เมื่อ เส้นล่างตัดขึ้นเหนือเส้นบน ตัวบ่งชี้จะทำเครื่องหมาย จุดเริ่มต้นของช่องที่เป็นไปได้.
- จากแท่งเทียนนั้น มันติดตาม ระยะเวลา และ สูงสุดสูง / ต่ำสุดต่ำ ในช่วงเวลานั้น
- การสร้างช่อง
-
- เมื่อภายหลัง เส้นบนตัดกลับขึ้นเหนือเส้นล่าง และระยะเวลามากกว่า 10 แท่งเทียน:
-
- มันกำหนด ยอดช่อง เป็นค่าสูงสุดสูงในช่วงเวลานั้น
- มันกำหนด ฐานช่อง เป็นค่าต่ำสุดต่ำ
- มันวัด ATR/2 ปัจจุบันเพื่อแยกโซนบางที่ด้านบนและด้านล่าง:
-
- แถบสีแดง ที่ด้านบน (แถบขาลง)
- แถบสีเขียว ที่ด้านล่าง (แถบขาขึ้น)
- มันวาด:
-
- สี่เหลี่ยมกรอบสีเทา เส้นขอบ (ช่องเต็ม)
- เส้นขอบด้านบนสีแดง
- เส้นขอบด้านล่างสีเขียว
- เส้นกลางประสีขาว จุด ผ่านศูนย์กลาง
- ช่องเหล่านี้ยังคงอยู่บนกราฟในฐานะโครงสร้างทางประวัติศาสตร์ (จะไม่ถูกลบหลังจากเบรกเอาต์)
- การตรวจจับเบรกเอาต์
-
- สำหรับแต่ละช่องที่ใช้งานอยู่ ในทุกแท่งเทียนใหม่ มันคำนวณ ราคามาตรฐาน:
-
- ถ้า Strong Closes Only = true → ใช้ จุดกึ่งกลางของแท่งเทียน:
refPrice=(Open+Close)/2\text{refPrice} = (\text{Open} + \text{Close})/2refPrice=(Open+Close)/2
ซึ่งต้องการให้มากกว่าครึ่งหนึ่งของแท่งเทียนอยู่นอกกล่อง - ถ้า Strong Closes Only = false → ใช้ ราคาปิด ธรรมดา
- ถ้า Strong Closes Only = true → ใช้ จุดกึ่งกลางของแท่งเทียน:
- กฎเบรกเอาต์:
-
- ถ้า
refPrice > Top→ เบรกเอาต์ขาขึ้น -
- แสดง จุดสีเขียว ที่ ฐานช่อง.
- ปิดการใช้งานช่องนี้ (หยุดการขยาย) แต่กล่องยังคงมองเห็นได้
- ถ้า
refPrice < Bottom→ เบรกเอาต์ขาลง -
- แสดง จุดสีแดง ที่ ยอดช่อง.
- ปิดการใช้งานช่องนี้
- ถ้าไม่เป็นเช่นนั้น ช่องยังคงใช้งานอยู่และขอบด้านขวาจะขยายไปยังแท่งเทียนปัจจุบัน
- ถ้า
- ตัวเลือกช่องซ้อน
-
- ถ้า Nested Channels = true ช่องหลายช่องสามารถทับซ้อนกันในเวลาและราคาได้
- ถ้า false ตัวบ่งชี้จะบล็อกการสร้างช่องใหม่ที่ทับซ้อนกับช่องที่มีอยู่แล้ว
วิธีอ่านและใช้งาน
- กล่องสีเทา (ช่อง)
-
- แทนโซน การรวมตัว / สมดุล ที่ราคาซื้อขายอยู่ช่วงเวลาหนึ่ง
- กล่องที่ยาวและสูงกว่าจะบ่งบอกถึงช่วงที่สำคัญมากขึ้น
- แถบบนสีแดง (โซนแนวต้าน)
-
- ส่วนบนของช่อง เน้นด้วยสายตาเป็น พื้นที่แนวต้านที่เป็นไปได้.
- การปฏิเสธซ้ำใกล้แถบนี้บ่งชี้แรงขายภายในช่วง
- แถบล่างสีเขียว (โซนแนวรับ)
-
- ส่วนล่างของช่อง เน้นเป็น แนวรับที่เป็นไปได้.
- การดีดตัวซ้ำบ่งชี้ผู้ซื้อปกป้องขอบล่างของช่วง
- เส้นกลางประสีขาว
-
- จุดกึ่งกลางของช่อง – เป็นเหมือน “มูลค่ายุติธรรม” ในท้องถิ่น
- ราคาที่แกว่งไกวรอบเส้นนี้บ่งชี้สมดุล การเคลื่อนไหวที่แข็งแกร่งออกจากเส้นนี้มักนำหน้าการทดสอบแถบตรงข้าม
- จุดเบรกเอาต์
-
- จุดสีเขียวใต้กล่อง:
-
- ราคาปิดอย่างแข็งแกร่งเหนือยอดช่อง (หรือปิดเหนืออย่างง่าย ขึ้นอยู่กับ Strong Closes Only)
- บ่งชี้ เบรกเอาต์ขาขึ้น – จุดเริ่มต้นที่เป็นไปได้ของการเคลื่อนไหวขึ้นจากการบีบตัวของความผันผวน
- จุดสีแดงเหนือกล่อง:
-
- ราคาปิดอย่างแข็งแกร่งต่ำกว่าฐานช่อง
- บ่งชี้ เบรกเอาต์ขาลง – จุดเริ่มต้นที่เป็นไปได้ของการเคลื่อนไหวลง
- วิธีการใช้งานทั่วไป (ระดับแนวคิด)
-
- เบรกเอาต์ตามแนวโน้ม
-
- เทรดตามทิศทางของเบรกเอาต์ (ซื้อหลังจุดสีเขียว ขายหลังจุดสีแดง) โดยควรสอดคล้องกับแนวโน้มกรอบเวลาที่สูงกว่าหรืออินดิเคเตอร์อื่นๆ
- ตัวกรองและการยืนยัน
-
- ใช้ช่องและเบรกเอาต์เป็น ตัวกรอง สำหรับกลยุทธ์ที่มีอยู่ของคุณ (เช่น รับเฉพาะการตั้งค่าซื้อถ้าสัญญาณล่าสุดเป็นเบรกเอาต์ขาขึ้น)
- การวางความเสี่ยง
-
- สำหรับเบรกเอาต์ขาขึ้น เทรดเดอร์หลายคนวางจุดหยุด ภายในหรือใต้ช่องเดิม; สำหรับเบรกเอาต์ขาลง วางภายในหรือเหนือกล่อง
สรุป
สรุปโดย AI
Breakout Channels is a technical indicator designed to identify consolidation zones and signal potential price breakouts. It automatically detects price ranges where the market is coiling, marking these with a grey channel box that highlights the consolidation area. The indicator draws a red upper band indicating potential resistance, a green lower band indicating potential support, and a white dotted midline representing the channel midpoint or local fair value.
Breakout points are signaled by colored dots: a green or cyan dot below the box indicates a bullish breakout, while a red dot above signals a bearish breakout. The indicator calculates these zones by normalizing price data, measuring volatility through the standard deviation of normalized prices, and identifying volatility extremes to define channel start and duration.
Channels remain visible on the chart as historical structures even after breakouts. Users can enable nested channels to allow overlapping consolidation zones. Breakout detection uses either candle body midpoints or close prices, depending on settings, to confirm strong closes outside the channel.
Typical uses include trading in the breakout direction, filtering existing strategies, and placing risk stops near channel boundaries. The indicator supports various markets including forex, indices, commodities, stocks, and cryptocurrencies.
โปรไฟล์อินดิเคเตอร์
รีวิวจากลูกค้า
0.0
รีวิว: 0
รีวิวจากลูกค้า
ยังไม่มีรีวิวสำหรับผลิตภัณฑ์นี้ หากเคยลองแล้ว ขอเชิญมาเป็นคนแรกที่บอกคนอื่น!
การสนทนา
คำถามที่พบบ่อย
Signal
Indices
Commodities
GBPUSD
RSI
Bollinger
Fibonacci
Scalping
AI
XAUUSD
NAS100
MACD
BTCUSD
Forex
Breakout
EURUSD
NZDUSD
Martingale
Prop
ZigZag
Supertrend
Fair Value Gap
SMC
Crypto
Grid
Stocks
ATR
USDJPY
VWAP
ผลิตภัณฑ์ที่มีให้บริการผ่าน cTrader Store รวมถึงบอทการเทรด อินดิเคเตอร์ และปลั๊กอิน มีให้บริการโดยนักพัฒนาบุคคลที่สามและมีไว้เพื่อวัตถุประสงค์ในการเข้าถึงข้อมูลและทางเทคนิคเท่านั้น cTrader Store ไม่ใช่โบรกเกอร์และไม่ได้ให้คำแนะนำการลงทุน คำแนะนำส่วนบุคคล หรือการรับประกันผลการดำเนินงานในอนาคต


ราคา
42.11M
ปริมาณการเทรด
6.13M
Pips ที่ได้กำไร
230
การขาย
8.51K
ติดตั้งฟรี