คำอธิบาย
เครื่องสแกนแนวโน้มหลายกรอบเวลา – อ่านเรื่องราวตลาดทั้งหมดได้ในพริบตา
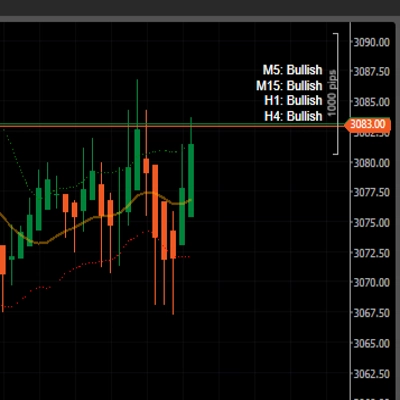
เครื่องสแกนแนวโน้มหลายกรอบเวลา มอบมุมมองที่ชัดเจนและกะทัดรัดของแนวโน้มใน หลายกรอบเวลา โดยตรงบนกราฟ cTrader ของคุณ – ตั้งแต่ M5 ถึง D1 – พร้อมกับความลำเอียงในการเทรดโดยรวมที่ชัดเจน:
➡️ ซื้อแรง / ซื้อ / เป็นกลาง / ขาย / ขายแรง
แทนที่จะกระโดดไปมาระหว่างกราฟและเดา คุณจะได้รับแผนที่แนวโน้มหลายกรอบเวลาที่มีโครงสร้างในที่เดียว
🧠 เครื่องยนต์คะแนนแนวโน้มอัจฉริยะ
สำหรับแต่ละกรอบเวลาที่เปิดใช้งาน (M5, M15, M30, H1, H4, D1) ตัวบ่งชี้จะคำนวณคะแนนแนวโน้มที่แข็งแกร่งโดยใช้สามองค์ประกอบหลัก:
- 📈 EMA (ทิศทางและความชันของแนวโน้ม)
-
- ราคาเทียบกับ EMA (เหนือ/ต่ำกว่า)
- ความชันของ EMA (เพิ่มขึ้น/ลดลง)
- 💪 RSI (โมเมนตัม)
-
- ปรับมาตรฐานรอบระดับ 50
- 🌊 ATR (ตัวกรองความผันผวนเสริม)
-
- เลือกที่จะไม่สนใจสภาวะความผันผวนต่ำมาก
แต่ละกรอบเวลาจะได้รับคะแนนในช่วง -100 ถึง +100 แล้วแปลงเป็นสถานะที่ง่ายต่อการเข้าใจ:
- 🟢 ขึ้น – มีแนวโน้มขาขึ้น
- 🔴 ลง – มีแนวโน้มขาลง
- 🟡 นิ่ง – แนวโน้มด้านข้าง / ไม่ชัดเจน
คุณจะเห็นทันทีว่ากรอบเวลาใดเห็นด้วยกันและความลำเอียงทิศทางที่แท้จริงอยู่ที่ไหน
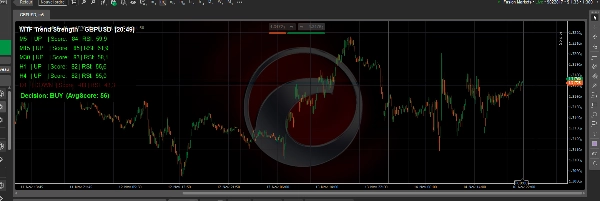
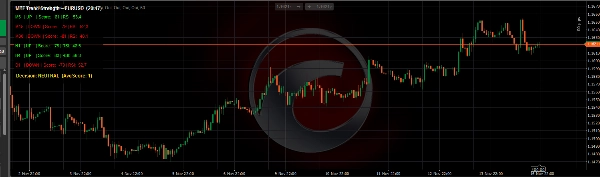
📊 แดชบอร์ดที่สะอาดและน้ำหนักเบาบนกราฟ
เครื่องมือนี้วาด แผง UI ขนาดเล็ก บนกราฟของคุณ ออกแบบมาให้อ่านง่ายแต่ไม่รบกวน:
- หนึ่ง บรรทัดต่อกรอบเวลา เช่น:
M15 | ขึ้น | คะแนน: 63 | RSI: 61.2 - รหัสสี:
-
- สีเขียวสำหรับขึ้น
- สีแดงสำหรับลง
- สีทองสำหรับนิ่ง
- แผงสามารถวางไว้ที่มุม บนซ้าย หรือ บนขวา
- แผงปรับแต่งได้:
-
- สีพื้นหลังและความทึบแสง
- ขนาดตัวอักษร
- ความสูงบรรทัด
- สีสำหรับขาขึ้น / ขาลง / เป็นกลาง
เหมาะสำหรับนักเก็งกำไรระยะสั้น นักเทรดรายวัน และนักเทรดสวิงที่ต้องการยืนยันภาพรวมใหญ่ได้อย่างรวดเร็ว
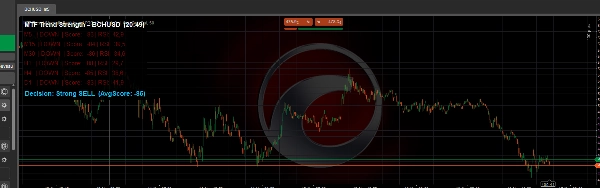
🧭 เส้นความลำเอียงการเทรดทั่วโลก
ที่ด้านล่างของแผง, เครื่องสแกนแนวโน้มหลายกรอบเวลา คำนวณ คะแนนเฉลี่ย ของกรอบเวลาที่ใช้งานทั้งหมดและแปลงเป็นความลำเอียงทั่วโลกที่ชัดเจน:
- ✅ ซื้อแรง – การจัดแนวขาขึ้นที่แข็งแกร่งในหลายกรอบเวลา
- ✅ ซื้อ – มีแนวโน้มขาขึ้น แต่ไม่สุดโต่ง
- ⚪ เป็นกลาง – ตลาดผสมหรือแกว่ง
- ❌ ขาย – มีแนวโน้มขาลง
- ❌ ขายแรง – การจัดแนวขาลงที่แข็งแกร่ง
นี่ทำให้เหมาะสมเป็น ตัวกรองแนวโน้มและทิศทาง สำหรับ:
- การเทรดด้วยตนเอง (เทรดเฉพาะในทิศทางของความลำเอียง)
- การเข้าเทรดแบบสแคปปิ้งที่ได้รับการยืนยันจากกรอบเวลาที่สูงกว่า
- การเทรดสวิงที่สอดคล้องกับ H1 / H4 / D1
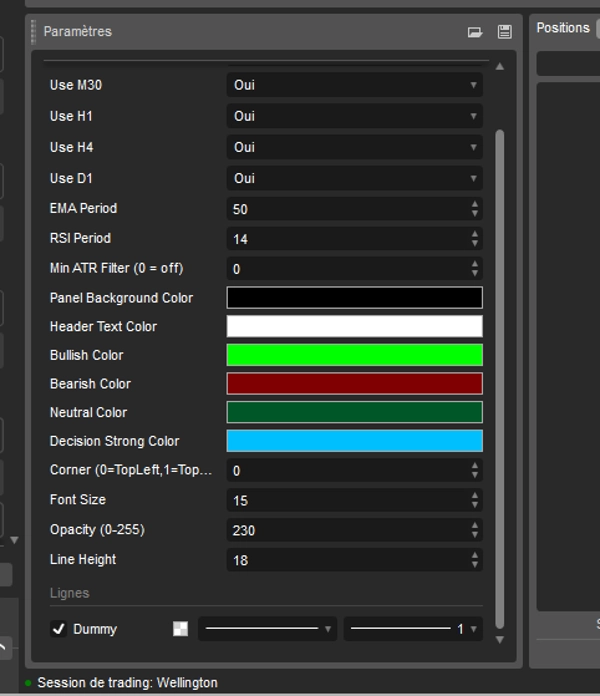
🔧 ปรับแต่งได้อย่างเต็มที่
คุณควบคุมตรรกะและรูปลักษณ์ได้อย่างเต็มที่:
- เปิด/ปิดแต่ละกรอบเวลา (M5, M15, M30, H1, H4, D1)
- กำหนดค่า:
-
- ช่วง EMA (ความไวของแนวโน้ม)
- ช่วง RSI (พฤติกรรมโมเมนตัม)
- ตัวกรองขั้นต่ำ ATR (0 = ปิด)
- การตั้งค่าด้านภาพ:
-
- สีพื้นหลังแผงและความโปร่งใส
- สีข้อความหัวข้อและบรรทัด
- สีสำหรับขาขึ้น / ขาลง / เป็นกลาง / ความลำเอียงแรง
- ขนาดตัวอักษรและระยะห่างบรรทัด
ตัวบ่งชี้ทำงานกับสัญลักษณ์ใดก็ได้ที่ cTrader รองรับ: ฟอเร็กซ์, ดัชนี, ทองคำ, คริปโต, หุ้น.
หากคุณต้องการวิธีที่ชัดเจน เป็นกลาง และมองเห็นได้ในการอ่านการจัดแนวแนวโน้มในหลายกรอบเวลาและตัดสินใจอย่างรวดเร็วว่าตลาดเหมาะสมกับการซื้อ ขาย หรือรออยู่ข้างๆ มากกว่ากัน, เครื่องสแกนแนวโน้มหลายกรอบเวลา คือเครื่องมือที่ทรงพลังที่จะเพิ่มเข้ากล่องเครื่องมือ cTrader ของคุณ
สรุป
The indicator displays a compact, color-coded dashboard on the chart, showing one line per timeframe with trend status, score, and RSI value. Users can customize the panel’s position, colors, font size, and which timeframes to include. A global trading bias line at the bottom summarizes the average score across timeframes into five bias states: Strong BUY, BUY, NEUTRAL, SELL, and Strong SELL. This feature supports manual trading, scalping, and swing trading by providing clear directional guidance.
Multi Timeframe Trend Scanner works on any cTrader-supported symbol, including forex, indices, commodities, cryptocurrencies, and stocks. It is designed to help traders quickly assess trend alignment and market bias in a single, easy-to-read interface.
รีวิวจากลูกค้า
5 | 100 % | |
4 | 0 % | |
3 | 0 % | |
2 | 0 % | |
1 | 0 % |