
KDJ
Gösterge
255 i̇ndirmeler
Sürüm 1.0, Dec 2024
Windows, Mac
5.0
Değerlendirmeler: 1
Açıklama
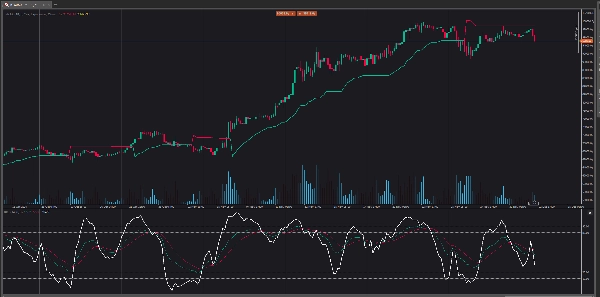
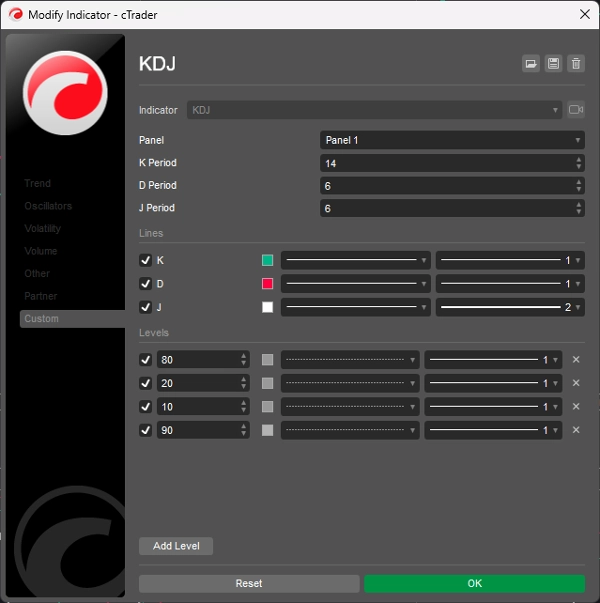
KDJ osilatör göstergesi 3 çizgiden (K, D ve J - bu yüzden göstergenin adı) ve 2 seviyeden oluşur. K ve D, stokastik osilatör kullanılırken aynı çizgilerdir. J çizgisi, D değerinin K değerinden sapmasını temsil eder. Bu çizgilerin yakınsaması yeni ticaret fırsatlarını gösterir. Stokastik Osilatör gibi, aşırı satım ve aşırı alım seviyeleri, trendin muhtemelen tersine döneceği zamanlara karşılık gelir.
Özet
YZ özeti
The KDJ indicator is an oscillator consisting of three lines: K, D, and J, along with two reference levels. The K and D lines correspond to those used in the stochastic oscillator, while the J line measures the deviation of the D value from the K value. This convergence of the three lines is used to identify potential new trading opportunities. Similar to the stochastic oscillator, the KDJ indicator highlights overbought and oversold conditions, which often signal possible trend reversals. This tool is designed to assist traders in timing entries and exits by analyzing momentum and trend strength through these oscillating lines.
Gösterge profili
Müşteri değerlendirmeleri
5.0
Değerlendirmeler: 1
5 | 100 % | |
4 | 0 % | |
3 | 0 % | |
2 | 0 % | |
1 | 0 % |
Müşteri değerlendirmeleri
August 18, 2025
Pros: Three-line stochastic oscillator (K, D, J) that identifies overbought/oversold levels and momentum shifts. Supports divergence analysis and crossovers between K and D as trading signals. Lightweight and responsive. Cons: No alerts, tooltips, or settings presets. J‑line can generate outlier v
Tartışma
SSS
cTrader Store üzerinden erişilebilen işlem botları, göstergeler ve eklentiler gibi ürünler, üçüncü taraf sağlayıcılar tarafından sağlanır ve yalnızca bilgilendirme ve teknik erişim amaçlarıyla sunulur. cTrader Store bir broker değildir ve yatırım tavsiyesi, kişisel öneriler vermez veya gelecekteki performansı garanti etmez.
Bu oluşturanın diğer ürünleri


Fiyat
2
Satışlar
6.9K
Ücretsiz yüklemeler