
AsiaSession
อินดิเคเตอร์
226 ดาวน์โหลด
เวอร์ชัน 1.0, Dec 2025
Windows, Mac
คำอธิบาย
📜 คำอธิบาย
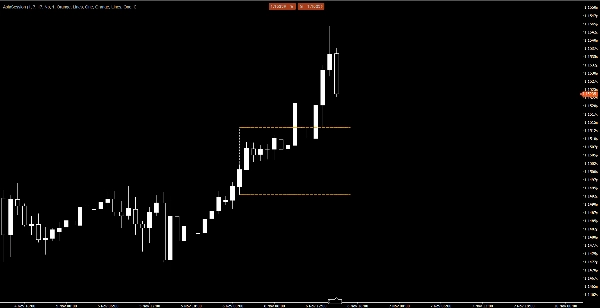
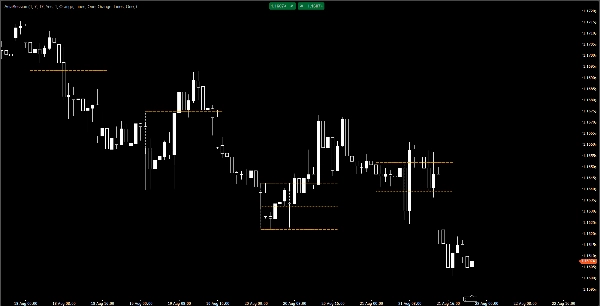
AsiaSession Indicator เป็นเครื่องมือที่กำหนดเองสำหรับแพลตฟอร์ม cTrader ที่เน้นช่วงเวลาการซื้อขายในเซสชันเอเชีย โดยจะวาดกล่องเซสชันครบถ้วนพร้อมขอบเขตแนวตั้งสำหรับเวลาที่เริ่มต้นและสิ้นสุด และเส้นแนวนอนสำหรับระดับสูง ต่ำ และกลาง ซึ่งทำให้มีประโยชน์อย่างยิ่งสำหรับเทรดเดอร์ที่ใช้ Smart Money Concepts (SMC) และ ICT strategies ซึ่งระดับเซสชันเอเชียมักทำหน้าที่เป็นโซนสภาพคล่อง
✨ คุณสมบัติหลัก
- วาด กล่องเซสชันครบถ้วน:
-
- เส้นซ้าย (เริ่มเซสชัน)
- เส้นขวา (สิ้นสุดเซสชัน)
- เส้นบน (สูงสุดของเอเชีย)
- เส้นล่าง (ต่ำสุดของเอเชีย)
- เส้นกลาง (กลางของเอเชีย)
- ขยายเส้นสูง/ต่ำ/กลางไปข้างหน้า จนถึงเวลาที่ผู้ใช้กำหนด
- กำหนดได้ สี, รูปแบบ, และความหนา สำหรับแต่ละเส้น
- ตัวเลือกแสดง เฉพาะวันปัจจุบัน หรือรวม เซสชันในอดีต
- พารามิเตอร์ UTC offset ในตัวสำหรับปรับโซนเวลา
- ข้ามวันหยุดสุดสัปดาห์โดยอัตโนมัติเพื่อหลีกเลี่ยงเซสชันผิดพลาด
- สถาปัตยกรรมที่สะอาดและมุ่งเน้นวัตถุด้วย enums, helpers, models, และ services
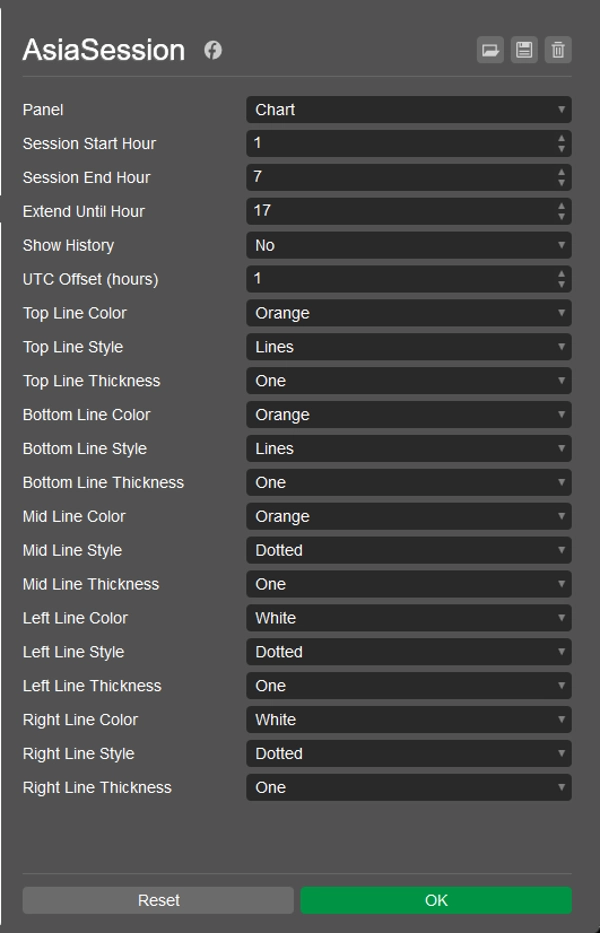
⚙️ พารามิเตอร์
- ชั่วโมงเริ่มเซสชัน / ชั่วโมงสิ้นสุดเซสชัน – กำหนดขอบเขตเซสชันเอเชีย
- ขยายจนถึงชั่วโมง – ควบคุมระยะเวลาที่เส้นขยายไปข้างหน้า
- แสดงประวัติ – สลับกล่องเซสชันในอดีต
- UTC Offset – ปรับให้ตรงกับโซนเวลาท้องถิ่นหรือเวลาของเซิร์ฟเวอร์โบรกเกอร์
- การปรับแต่งเส้น – ตั้งค่าสี รูปแบบ และความหนาสำหรับแต่ละขอบเขต
📈 วิธีใช้
- ติดตั้งอินดิเคเตอร์ใน cTrader Automate.
- แนบมันเข้ากับชาร์ตของคุณ
- ปรับพารามิเตอร์ให้ตรงกับโซนเวลาและความชอบในการเทรดของคุณ
- เปิดใช้งาน แสดงประวัติ เพื่อดูภาพเซสชันที่ผ่านมา
📦 ใบอนุญาต
เผยแพร่ภายใต้ MIT License – ใช้งาน แก้ไข และแจกจ่ายได้ฟรี
สรุป
สรุปโดย AI
AsiaSession is a custom indicator for the cTrader platform designed to visualize the Asian trading session range. It draws a complete session box on the chart, including vertical lines marking the session start and end times, and horizontal lines indicating the session’s high, low, and mid levels. These lines can be extended into the future up to a user-defined time. The indicator supports customizable colors, styles, and thickness for each line, allowing traders to tailor the display to their preferences.
Key parameters include session start and end hours, extension duration for the lines, an option to show historical sessions or only the current day, and a built-in UTC offset for timezone adjustments. The indicator automatically skips weekends to avoid displaying false sessions. Its architecture is object-oriented, facilitating clean and efficient operation.
AsiaSession is particularly useful for traders applying Smart Money Concepts (SMC) and ICT strategies, where Asian session levels often serve as liquidity zones. Installation involves adding the indicator to cTrader Automate and configuring parameters to match the trader’s timezone and preferences. The product is published under the MIT License, permitting free use, modification, and distribution.
โปรไฟล์อินดิเคเตอร์
รีวิวจากลูกค้า
0.0
รีวิว: 0
รีวิวจากลูกค้า
ยังไม่มีรีวิวสำหรับผลิตภัณฑ์นี้ หากเคยลองแล้ว ขอเชิญมาเป็นคนแรกที่บอกคนอื่น!
การสนทนา
คำถามที่พบบ่อย
Forex
EURUSD
SMC
ผลิตภัณฑ์ที่มีให้บริการผ่าน cTrader Store รวมถึงบอทการเทรด อินดิเคเตอร์ และปลั๊กอิน มีให้บริการโดยนักพัฒนาบุคคลที่สามและมีไว้เพื่อวัตถุประสงค์ในการเข้าถึงข้อมูลและทางเทคนิคเท่านั้น cTrader Store ไม่ใช่โบรกเกอร์และไม่ได้ให้คำแนะนำการลงทุน คำแนะนำส่วนบุคคล หรือการรับประกันผลการดำเนินงานในอนาคต
เพิ่มเติมจากผู้เขียนคนนี้


!["[Stellar Strategies] Inside Bar with Signals" โลโก้](https://cdn.ctrader.com/image/webp/1d9e8bfa-3b2c-4440-bb37-5856902008a7_30683)


ราคา
ตั้งแต่ 24/09/2025
369
ติดตั้งฟรี