คำอธิบาย
Pinescritlabs
ตัวบ่งชี้ร้าน Ctrader: 🤖Pinescritlabs Ctrader Store cBots:
Fair Value Gap Sessions Gold & BTC Breakout Session Pivots(ใหม่)
โครงสร้างตลาดแบบไดนามิก
การวิเคราะห์จุดเปลี่ยน
ฟีโบนักชีเชิงเส้น
การถดถอยหลายกรอบเวลา
ความลำเอียงของแท่งเทียนหลายระดับ
ตัวติดตาม
เส้นแนวโน้มสนับสนุนและ
แนวต้านอัตโนมัติ
ระดับสนับสนุนและ
แนวต้านทั้งหมด
แผนที่การชำระบัญชีด้วยเลเวอเรจ
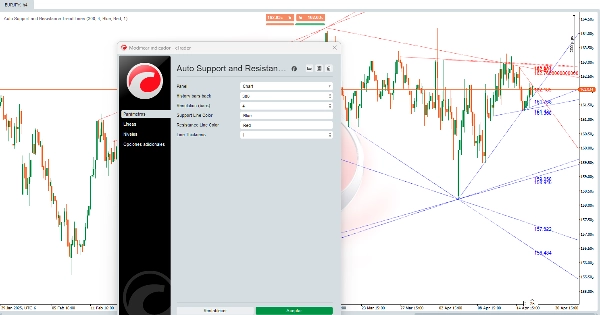
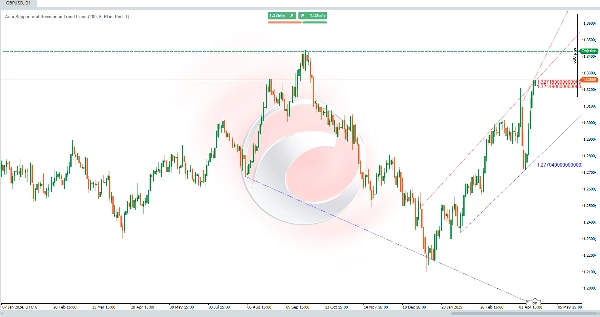
เส้นแนวโน้มสนับสนุนและแนวต้านอัตโนมัติ:
อัลกอริทึมนี้เป็น เครื่องมือที่ทรงพลัง 🛠️ ออกแบบมาเพื่อ ระบุระดับสนับสนุนและแนวต้านโดยอัตโนมัติ บนกราฟราคา ไม่เพียงแต่จะวาด เส้นแนวนอน แต่ยังติดตาม ช่องแนวทแยง ↗️↘️ ที่แสดงถึงแนวโน้มตลาด ระดับและช่องเหล่านี้เป็น พื้นที่สำคัญ ที่ราคาพยายามเคลื่อนที่ขึ้น (แนวต้าน 🚧) หรือลง (แนวรับ 🛡️) ทำให้เป็น จุดสำคัญ สำหรับการตัดสินใจซื้อขาย 📈📉
การคำนวณทำอย่างไร? 🔍
อัลกอริทึมใช้ วิธีวิเคราะห์ประวัติราคา 📊 เพื่อระบุระดับสนับสนุนและแนวต้าน ดังนี้:
- การระบุจุดต่ำสุดและสูงสุดในท้องถิ่น ⬇️⬆️
-
- อัลกอริทึมวิเคราะห์ราคาภายในช่วงของแท่งเทียน (bars) ที่กำหนดเพื่อค้นหา จุดต่ำสุดในท้องถิ่น (ราคาต่ำสุดในช่วงนั้น) และ จุดสูงสุดในท้องถิ่น (ราคาสูงสุดในช่วงนั้น)
- จุดต่ำสุดและสูงสุดเหล่านี้เป็น ผู้สมัครที่เป็นไปได้ ที่จะกลายเป็นระดับสนับสนุนและแนวต้าน
- การตรวจสอบความถูกต้องของระดับ ✔️
-
- เมื่อระบุจุดต่ำสุดและสูงสุดในท้องถิ่นแล้ว อัลกอริทึมจะตรวจสอบว่าระดับเหล่านี้ได้รับ การเคารพจากราคา ในอดีตหรือไม่
- ถ้าราคาสัมผัสระดับนั้นหลายครั้งโดยไม่ทะลุอย่างชัดเจน ถือว่าเป็น ระดับสนับสนุนหรือแนวต้านที่ถูกต้อง.
- การวาดเส้นและช่อง ✏️
-
- ระดับสนับสนุนจะถูกวาดเป็น เส้นแนวนอน (หรือแนวทแยง) ที่จุดต่ำสุดในท้องถิ่นที่ได้รับการตรวจสอบ
- ระดับแนวต้านจะถูกวาดเป็น เส้นแนวนอน (หรือแนวทแยง) ที่จุดสูงสุดในท้องถิ่นที่ได้รับการตรวจสอบ
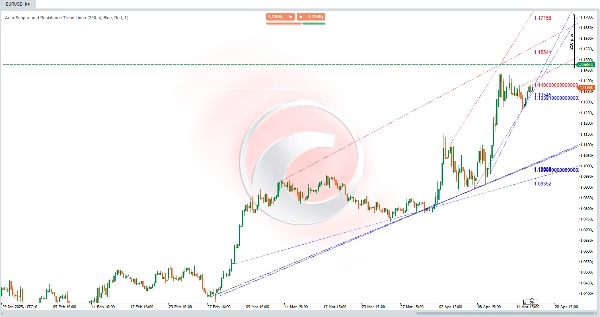
- นอกจากนี้ อัลกอริทึมยังเชื่อมต่อระดับเหล่านี้เพื่อสร้าง ช่องแนวทแยง ↗️↘️ ซึ่งแสดงถึง แนวโน้มขาขึ้นหรือลง ในตลาด
- การอัปเดตแบบไดนามิก 🔄
-
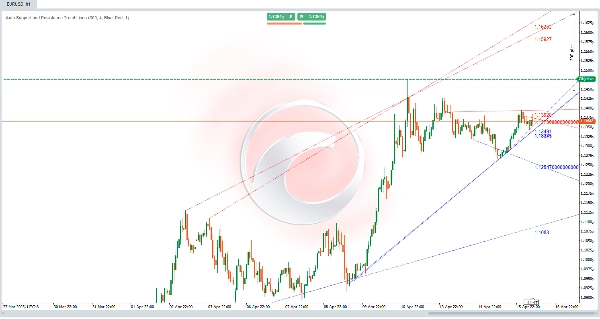
- ตัวบ่งชี้ อัปเดตโดยอัตโนมัติ เมื่อมีแท่งเทียนใหม่ คำนวณและวาดระดับสนับสนุนและแนวต้านใหม่ตามพฤติกรรมราคาล่าสุด
อัลกอริทึมนี้ช่วยเทรดเดอร์อย่างไร? 💡
อัลกอริทึมนี้เป็น เกมเปลี่ยนแปลง สำหรับเทรดเดอร์เพราะ:
- ให้ภาพรวมตลาดในระดับมหภาค 🌐
-
- โดยการวาด ช่องแนวทแยง อัลกอริทึมจะแสดง แนวโน้มหลักของตลาด ช่วยให้เทรดเดอร์ระบุได้ว่าราคากำลังอยู่ใน แนวโน้มขาขึ้น 📈, แนวโน้มขาลง 📉 หรือ การเคลื่อนไหวด้านข้าง ↔️.
- ระบุพื้นที่สนับสนุนและแนวต้านสำคัญ 🎯
-
- ระดับสนับสนุนและแนวต้านเป็น โซน ที่ราคาสามารถ เด้งกลับหรือทะลุผ่าน ระดับเหล่านี้มีประโยชน์สำหรับ:
-
- กำหนด จุดเข้าและออก สำหรับการเทรด
- วางคำสั่ง หยุดขาดทุน 🛑 และ ทำกำไร ✅
- ระบุ การทะลุผ่าน 🚀 หรือ การกลับตัว 🔄 ของราคา
- ทำให้ง่ายขึ้นสำหรับการวิเคราะห์ทางเทคนิค 🕒
-
- อัลกอริทึม ทำงานอัตโนมัติ ในการระบุระดับสนับสนุนและแนวต้าน ช่วยประหยัดเวลาสำหรับเทรดเดอร์ที่ทำการวิเคราะห์ด้วยตนเอง
- โดยแสดงระดับและช่องอย่างชัดเจน ช่วยให้เทรดเดอร์ตัดสินใจได้ อย่างมีข้อมูลมากขึ้น.
- ปรับแต่งได้ 🎨
-
- เทรดเดอร์สามารถปรับพารามิเตอร์ เช่น จำนวนแท่งเทียนย้อนหลังที่วิเคราะห์, ความหนาของเส้น และ สี เพื่อให้ตัวบ่งชี้เหมาะสมกับสไตล์การเทรดและความชอบในการมองเห็นที่แตกต่างกัน
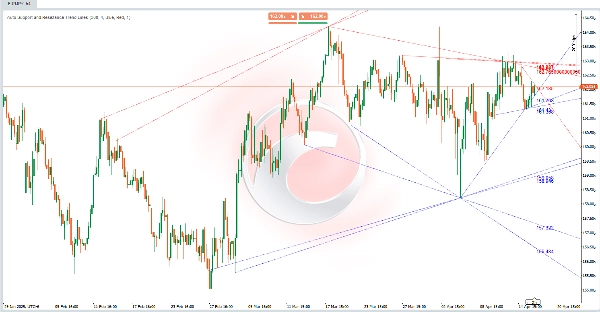
ตัวอย่างใช้งานจริง 📌
ลองนึกภาพว่าคุณกำลังวิเคราะห์กราฟราคา และอัลกอริทึมได้วาด:
- เส้นสนับสนุนแนวทแยง ↗️ เชื่อมต่อจุดต่ำสุดในท้องถิ่นหลายจุด แสดงถึง แนวโน้มขาขึ้น.
- เส้นแนวต้านแนวทแยง ↗️ เชื่อมต่อจุดสูงสุดในท้องถิ่นหลายจุด แสดงถึง ช่องทางขึ้น.
- เส้นแนวนอนหลายเส้น แสดงถึงระดับสนับสนุนและแนวต้านสำคัญ.
ด้วยข้อมูลนี้ คุณสามารถ:
- ระบุว่าราคากำลังอยู่ใน แนวโน้มขาขึ้น 📈.
- มองหา โอกาสซื้อ ใกล้เส้นสนับสนุนแนวทแยงหรือระดับสนับสนุนแนวนอน
- ตั้ง จุดหยุดขาดทุน 🛑 ต่ำกว่าระดับสนับสนุนที่ใกล้ที่สุด
- สังเกตว่าราคาจะ ทะลุแนวต้าน เพื่อยืนยันการดำเนินแนวโน้มหรือ การกลับตัว 🔄.
สรุป
Once validated, support and resistance levels are drawn as horizontal or diagonal lines, and connected to form channels indicating bullish or bearish trends. The indicator updates dynamically with each new bar, recalculating and redrawing levels to reflect the most recent price behavior.
This tool aids traders by providing a macro view of market trends, identifying zones where price may bounce or break, and simplifying technical analysis through automation. It supports setting entry and exit points, stop-loss and take-profit orders, and spotting potential breakouts or reversals. Parameters such as the number of historical bars analyzed, line thickness, and colors can be customized to fit different trading styles and preferences.