
คำอธิบาย
ค่าเฉลี่ยฟีโบนักชีรายวัน - ระดับฟีโบนักชีรายวันอัตโนมัติ
คาดการณ์ช่วงเฉลี่ยรายวันในระดับฟีโบนักชีจากราคาปิดเปิดของวัน
ตัวชี้วัดนี้ทำอะไร?
ค่าเฉลี่ยฟีโบนักชีรายวันจะวาดระดับฟีโบนักชีโดยอัตโนมัติตามช่วงเฉลี่ยรายวัน ทุกวัน ตัวชี้วัดจะคาดการณ์ระดับสำคัญทั้งขึ้นและลงจากราคาปิดเปิด ช่วยให้คุณระบุเป้าหมายที่เป็นไปได้และโซนกลับตัว
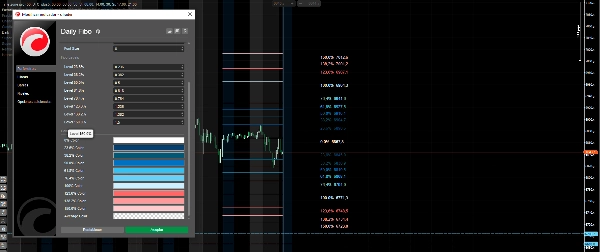
คุณสมบัติหลัก
✅ อัปเดตรายวันอัตโนมัติ - ระดับจะถูกวาดใหม่โดยอัตโนมัติทุกวัน ✅ ระดับที่ปรับแต่งได้ - กำหนดค่าระดับฟีโบนักชีได้สูงสุด 8 ระดับ ✅ สีที่ปรับแต่งได้ - แต่ละระดับมีสีที่ระบุได้เฉพาะตัว ✅ ป้ายแสดงราคาพร้อมป้ายชื่อ - แสดงทั้งเปอร์เซ็นต์และราคาที่แน่นอนของแต่ละระดับ ✅ ค่าเฉลี่ยรายวันที่ปรับได้ - เลือกจำนวนวันที่ใช้ในการคำนวณค่าเฉลี่ย (ค่าเริ่มต้น 20)
ระดับที่รวมมาโดยค่าเริ่มต้น
- 0% - ราคาปิดเปิดของวัน (เส้นฐาน)
- 23.6%, 38.2%, 50%, 61.8%, 76.4% - การดึงกลับและการขยายภายใน
- 100% - ช่วงเฉลี่ยทั้งหมด
- 123.6%, 138.2%, 150% - การขยายภายนอก
วิธีใช้ตัวชี้วัด
- ระบุทิศทาง - ราคาปิดเปิด (0%) คือจุดอ้างอิงของคุณ
- มองหาเป้าหมายขาขึ้น - ระดับบนแสดงเป้าหมายการซื้อ
- มองหาเป้าหมายขาลง - ระดับล่างแสดงเป้าหมายการขาย
- โซนกลับตัว - เมื่อราคาถึงระดับสุดขีด (100% ขึ้นไป) ให้มองหาการกลับตัวที่เป็นไปได้
พารามิเตอร์ที่ปรับได้
- จำนวนวันที่ใช้ในการคำนวณค่าเฉลี่ย
- ระดับฟีโบนักชีที่กำหนดเอง
- สีแต่ละระดับแยกกัน
- แสดง/ซ่อนป้ายชื่อและราคา
- ขนาดตัวอักษร
เหมาะสำหรับเทรดเดอร์ที่มองหาเป้าหมายที่ชัดเจนและโซนราคาที่น่าจะเป็นไปได้ในช่วงเวลาการเทรด
สรุป
รีวิวจากลูกค้า
5 | 50 % | |
4 | 50 % | |
3 | 0 % | |
2 | 0 % | |
1 | 0 % |


