คำอธิบาย
BB20 Multicolor
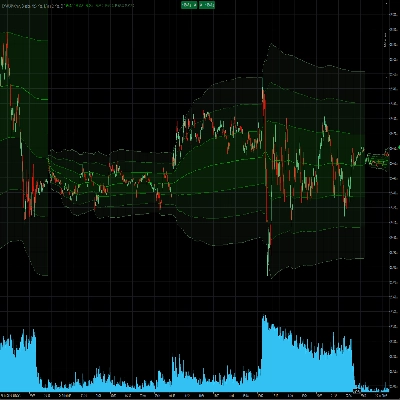
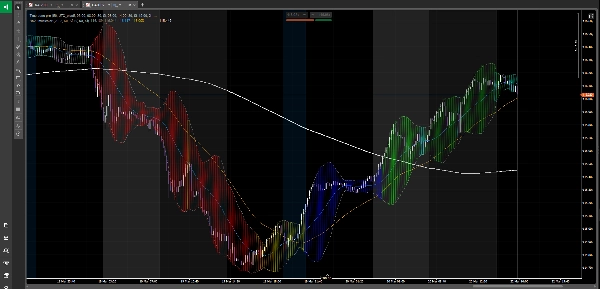
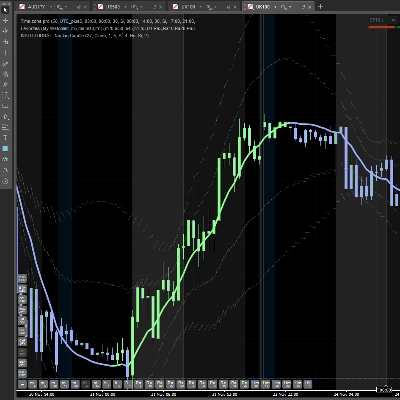
ตัวบ่งชี้ระบุรอบตลาดที่ทรงพลังซึ่งซ้อนทับโดยตรงบนแผนภูมิของคุณ โดยใช้สีเพื่อแสดงการเคลื่อนไหวของราคาใน 8 สถานะตลาดที่แตกต่างกัน — ตั้งแต่ตลาดหมีลึกจนถึงตลาดกระทิงเต็มรูปแบบ — โดยใช้ความสัมพันธ์ระหว่างราคาและค่าเฉลี่ยเคลื่อนที่สำคัญสี่ค่า (MM20, MM50, MM100, MM200) ร่วมกับ Bollinger Bands
──────────────────────────
วิธีการทำงาน
──────────────────────────
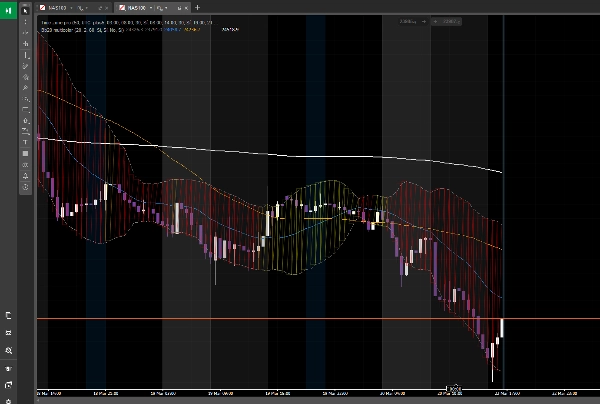
ตัวบ่งชี้จะประเมินตำแหน่งของราคาเมื่อเทียบกับค่าเฉลี่ยเคลื่อนที่ทั้งสี่อย่างต่อเนื่อง และกำหนดสีหนึ่งใน 8 สีให้กับโซนเมฆ Bollinger Band เพื่อให้คุณเห็นภาพสถานะรอบตลาดปัจจุบันทันที:
🔴 แดง — แนวโน้มตลาดหมีชัดเจน
ราคาต่ำกว่า MM200 ตลาดถูกครอบงำโดยผู้ขาย ความโน้มเอียง: เปิดสถานะขายเท่านั้น
🟠 ส้ม — การดีดตัวทางเทคนิค
ราคาต่ำกว่า MM200 แต่ฟื้นตัวขึ้นเหนือ MM20 การดีดตัวภายในแนวโน้มตลาดหมี — ไม่ใช่การกลับตัว เป็นโซนกับดักกระทิงทั่วไป
🟡 เหลือง — ระยะรอบที่ 1
ราคาข้ามขึ้นเหนือ MM50 แต่ค่าเฉลี่ยเคลื่อนที่ยังคงเป็นตลาดหมี สัญญาณแรกของการฟื้นตัว ยังไม่ยืนยัน
🔵 น้ำเงิน — ความพยายามกลับตัวแนวโน้ม
MM100 และ MM50 อยู่ต่ำกว่า MM200 แต่ราคากำลังเริ่มไต่ขึ้นระหว่างค่าเฉลี่ยเหล่านี้ โซนเปลี่ยนผ่านความผันผวนสูง — ควรเฝ้าดูอย่างใกล้ชิด
⬜ เทา — เป็นกลาง / อ่อนแรง
ราคาอยู่เหนือ MM200 แต่ต่ำกว่า MM100 โครงสร้างระยะยาวยังเป็นตลาดกระทิงแต่โมเมนตัมลดลง โซนระวัง
🟢 เขียวมะนาว — ระยะรอบที่ 2
ราคาและ MM50 อยู่เหนือ MM200 ยืนยันรอบตลาดกระทิงใหม่ เทรดเดอร์สถาบันหลายรายเริ่มเข้าตำแหน่งที่นี่
🪵 น้ำเงินเขียว — การรวมตัวที่แข็งแรง
ราคาอยู่เหนือ MM200 และ MM100 แต่กำลังถอยกลับไปทาง MM50 หรือ MM20 หยุดพักปกติภายในแนวโน้มตลาดกระทิง — โซนเข้าใหม่ที่เป็นไปได้
🌲 เขียวเข้ม — รอบตลาดกระทิงที่โตเต็มที่
ค่าเฉลี่ยเคลื่อนที่ทั้งหมดเรียงตัวอย่างสมบูรณ์: MM200 < MM50 < MM20 < ราคา สภาพแวดล้อมแนวโน้มที่สะอาดที่สุด ความต้านทานน้อยที่สุดทางขาขึ้น
──────────────────────────
คุณสมบัติ
──────────────────────────
• โซนเมฆแสดงผลโดยตรงด้วย Chart.DrawTriangle ของ cTrader เพื่อการเติมสีที่เรียบเนียนและดูเป็นมืออาชีพ
• แสดง Bollinger Bands (บนและล่าง) ควบคู่กับเมฆ
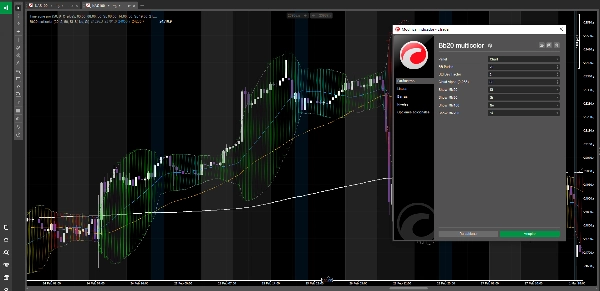
• ค่าเฉลี่ยเคลื่อนที่ทั้งสี่สามารถเปิด/ปิดได้แยกกัน (MM20, MM50, MM100, MM200)
• กำหนดค่าระยะเวลา BB, ปัจจัยส่วนเบี่ยงเบนมาตรฐาน และความโปร่งใสของเมฆได้
• ใช้งานได้กับเครื่องมือและกรอบเวลาทุกชนิด
• เปิดซอร์สเต็มรูปแบบ — ฟรีตลอดไป
──────────────────────────
วิธีใช้งาน
──────────────────────────
1. ใช้สีเป็นตัวกรองบริบทตลาดก่อนทำการเทรดใดๆ
2. มองหาการเปิดสถานะซื้อเฉพาะเมื่อพื้นหลังเป็นสีเขียว (มะนาวหรือเข้ม)
3. มองหาการเปิดสถานะขายเฉพาะเมื่อพื้นหลังเป็นสีแดงหรือส้ม
4. ใช้สีเหลือง น้ำเงิน และเทาเป็นโซนเปลี่ยนผ่าน — ลดขนาดหรือรอยืนยัน
5. สีฟ้าเขียวเป็นโซนเข้าใหม่ในแนวโน้มตลาดกระทิงที่ตั้งมั่น
เข้ากันได้กับกลยุทธ์การเทรดทุกชนิด โดยเฉพาะอย่างยิ่งเมื่อใช้ร่วมกับการวิเคราะห์ราคา ปริมาณ หรือแนวทางที่อิงความรู้สึกตลาด
ติดตั้ง วางบนแผนภูมิของคุณ และรู้ทันทีว่าตลาดอยู่ในระยะใด
⚠️ ข้อจำกัดความเสี่ยง
การเทรดเครื่องมือทางการเงินมีความเสี่ยงและไม่เหมาะกับทุกคน โปรดวิเคราะห์ด้วยตนเอง จัดการความเสี่ยงอย่างรอบคอบ และอย่าเทรดด้วยเงินที่คุณไม่สามารถเสียได้
ตัวบ่งชี้นี้เป็นเครื่องมือวิเคราะห์ทางเทคนิค — ไม่ใช่คำแนะนำทางการเงิน ใช้ด้วยความระมัดระวัง
สรุป
- Red: Clear bearish trend (price below MM200)
- Orange: Technical bounce within bearish trend
- Yellow: Early recovery signs (price above MM50, but MAs bearish)
- Blue: Trend reversal attempt with high volatility
- Gray: Neutral or weakening momentum (price above MM200 but below MM100)
- Lime Green: Confirmed new bullish cycle (price and MM50 above MM200)
- Teal: Healthy consolidation in bullish trend (price above MM200 and MM100, pulling back)
- Dark Green: Mature bullish cycle with aligned moving averages
Features include native cloud rendering using cTrader's Chart.DrawTriangle, toggleable moving averages, configurable Bollinger Bands parameters, and compatibility with any instrument and timeframe. The indicator is open source and free to use. It serves as a market context filter to guide trade decisions, recommending long positions in green zones and shorts in red/orange zones, with caution advised in transition colors. It complements various trading strategies, including price action and volume analysis.


!["[Stellar Strategies] Market Session Ultimate" โลโก้](https://cdn.ctrader.com/image/webp/61ffd537-0125-4246-9e72-42eca1791d64_28232)