
Descrizione
VOLUME HEATMAP PRO - Visualizzazione Professionale della Densità di Mercato
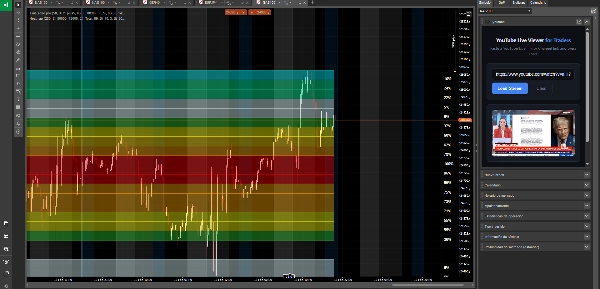
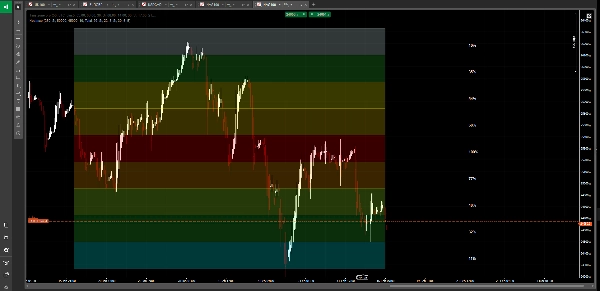
Osserva il mercato come mai prima d'ora con questa avanzata heatmap del volume che trasforma dati complessi di volume in una visualizzazione intuitiva. A differenza degli indicatori di volume tradizionali che mostrano solo barre nella parte inferiore del grafico, Volume Heatmap Pro rivela esattamente dove i trader istituzionali stanno accumulando e distribuendo posizioni a ogni livello di prezzo.
CARATTERISTICHE PRINCIPALI:
🔥 Heatmap Dinamica Codificata a Colori
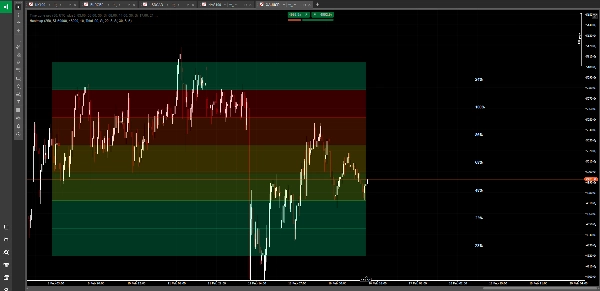
Sperimenta l'analisi del volume attraverso un sorprendente sistema a gradiente di colore a 10 livelli. Dal blu ghiaccio (attività minima) al rosso intenso (volume massimo), identifica istantaneamente dove fluisce il grande denaro. La heatmap si aggiorna in tempo reale, mostrando la densità di mercato a colpo d'occhio.
📍 Rilevamento del Punto di Controllo (POC)
Identifica automaticamente e evidenzia il livello di prezzo con il volume di scambio più alto - il vero punto di equilibrio del mercato. Qui le istituzioni hanno costruito le loro posizioni più grandi e dove il prezzo tende a tornare.
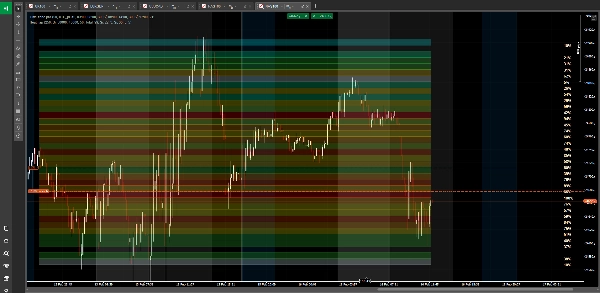
🎯 Distribuzione del Volume a Più Livelli
Divide il tuo intervallo di prezzo in fino a 50 livelli precisi, creando una mappa dettagliata della distribuzione del volume. Vedi esattamente quali prezzi hanno attratto un intenso trading e quali sono stati ignorati dal mercato.
📊 Tre Modalità di Analisi del Volume
• Volume Totale - Visualizza tutta l'attività di mercato
• Solo Volume di Acquisto - Isola le zone di pressione rialzista
• Solo Volume di Vendita - Identifica le aree di distribuzione ribassista
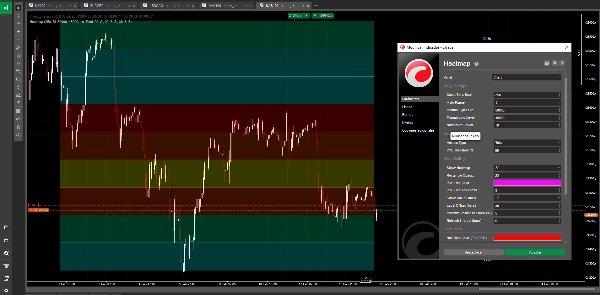
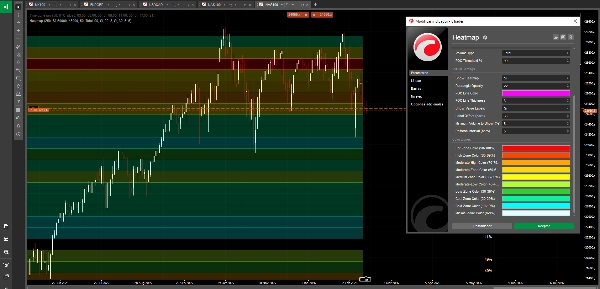
🎨 Visualizzazione Professionale
• Rettangoli codificati a colori che coprono il tuo periodo di analisi
• Opacità regolabile per un'integrazione perfetta nel grafico
• Etichette opzionali con percentuali di volume su ogni livello
• Linea POC personalizzabile con controllo dello spessore
• Visualizzazione pulita e non invasiva
⚙️ Tecnologia Smart Auto-Range
Calcola automaticamente l'intervallo di prezzo ottimale dal tuo periodo di lookback, oppure definisci manualmente il tuo intervallo per analisi specifiche. La heatmap si adatta a qualsiasi condizione di mercato o timeframe.
🔄 Ottimizzazione delle Prestazioni
Intervalli di aggiornamento configurabili garantiscono una performance fluida del grafico mantenendo un'analisi del volume accurata. Analizza fino a 500 barre indietro senza rallentamenti.
📈 Zone di Colore Personalizzabili
Personalizza tutte e 10 le zone di colore per adattarle alle tue preferenze visive:
• Zona Calda (90-100%) - Massima concentrazione di volume
• Zona Alta (80-89%) - Forte attività
• Moderato-Alto (70-79%) - Volume superiore alla media
• Moderato (60-69%) - Attività solida
• Medio (50-59%) - Volume medio
• Moderato-Basso (40-49%) - Sotto la media
• Zona Bassa (30-39%) - Attività leggera
• Zona Fresca (20-29%) - Trading minimo
• Zona Fredda (10-19%) - Volume molto leggero
• Minimo (0-9%) - Quasi nessuna attività
PERFETTO PER:
• Identificare zone di accumulo e distribuzione istituzionale
• Trovare nodi a basso volume per potenziali aree di breakout
• Individuare livelli di supporto e resistenza ad alto volume
• Comprendere la struttura del mercato e la liquidità
• Confermare le entrate di trading in aree ad alto volume
• Evitare zone trappola a bassa liquidità
• Analisi del profilo di volume multi-timeframe
COSA LO RENDE DIVERSO:
Gli indicatori di volume tradizionali mostrano QUANTO è stato scambiato, ma non DOVE. Volume Heatmap Pro rivela il quadro completo - una mappa visiva di densità che mostra esattamente quali livelli di prezzo hanno assorbito la maggior parte dell'attività di trading. Il sistema a gradiente di colore rende l'analisi complessa del volume semplice come leggere una mappa meteorologica. Il rosso significa caldo (volume elevato), il blu significa freddo (volume leggero).
Che tu stia facendo scalping su inversioni intraday o posizionandoti per swing trade, questa heatmap ti mostra dove il mercato ha vera convinzione rispetto a dove c'è solo rumore.
---
⚠️ AVVISO DI RISCHIO:
Il trading di valute estere, criptovalute e altri strumenti finanziari comporta un alto livello di rischio e potrebbe non essere adatto a tutti gli investitori. L'elevato grado di leva può agire contro di te così come a tuo favore. Prima di decidere di fare trading, dovresti considerare attentamente i tuoi obiettivi di investimento, il livello di esperienza e la propensione al rischio. Esiste la possibilità di subire una perdita di parte o di tutto il tuo investimento. Pertanto, non dovresti investire denaro che non puoi permetterti di perdere. Dovresti essere consapevole di tutti i rischi associati al trading e cercare il consiglio di un consulente finanziario indipendente se hai dubbi. Le performance passate non sono indicative di risultati futuri.
Riepilogo
Key features include automatic Point of Control (POC) detection, highlighting the price level with the highest trading volume, and multi-level volume distribution dividing the price range into up to 50 levels for detailed analysis. It supports three volume modes: total volume, buy volume only, and sell volume only, enabling users to isolate bullish or bearish pressure zones.
The indicator offers professional visualization with adjustable opacity, customizable color zones, optional volume percentage labels, and a customizable POC line. Smart auto-range technology calculates optimal price ranges based on the lookback period or manual input. Performance is optimized for smooth updates and analysis of up to 500 bars without lag.
Heatmap is suitable for identifying institutional accumulation and distribution zones, spotting support and resistance levels, understanding market structure, and conducting multi-timeframe volume profile analysis across markets including Forex, indices, and XAUUSD (gold).
Recensioni dei clienti
5 | 67 % | |
4 | 33 % | |
3 | 0 % | |
2 | 0 % | |
1 | 0 % |


