
ICT Order Block
อินดิเคเตอร์
706 ดาวน์โหลด
เวอร์ชัน 1.0, Nov 2025
Windows, Mac
3.5
รีวิว: 2
คำอธิบาย
ICT Order Block - Institutional Order Blocks
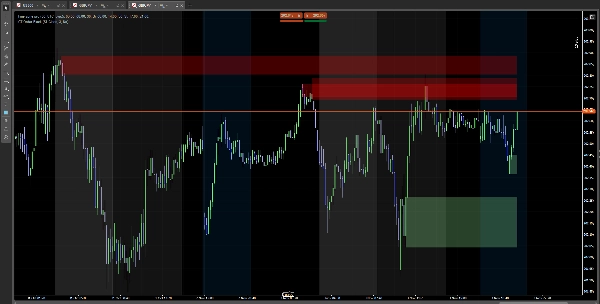
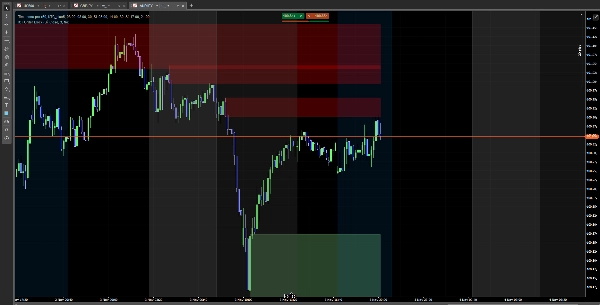
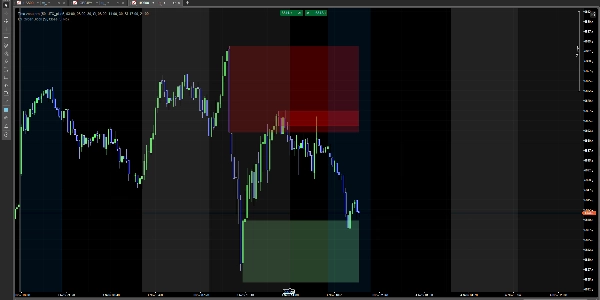
ระบุบล็อกคำสั่งสถาบันโดยอัตโนมัติบนแผนภูมิของคุณ แสดงโซนสำคัญที่ราคาอาจตอบสนอง
สิ่งที่มันทำ
✅ ตรวจจับบล็อกขาขึ้น (โซนซื้อของสถาบัน) ✅ ตรวจจับบล็อกขาลง (โซนขายของสถาบัน) ✅ แสดงสี่เหลี่ยมสีบนโซนสำคัญ ✅ บล็อกจะหายไปเมื่อราคาทะลุผ่าน
วิธีใช้
การติดตั้งง่าย
- ดาวน์โหลดตัวชี้วัด
- เพิ่มลงในแผนภูมิของคุณใน cTrader
- เสร็จ! คุณจะเห็นบล็อกโดยอัตโนมัติ
การตั้งค่า
การตั้งค่าหลัก
- แสดง SCOB: แสดงหรือซ่อนบล็อก
- วิธีการบรรเทา:
-
- ปิด: บล็อกจะหายไปเมื่อแท่งเทียนปิด
- ไส้เทียน: บล็อกจะหายไปเมื่อถูกแตะ
- แสดง SCOB ล่าสุด X บล็อก: จำนวนบล็อกที่จะแสดง (1-15)
- ใช้ตัวกรองความผันผวน: กรองบล็อกตามความผันผวน
สี
- สีขาขึ้น: สีสำหรับบล็อกขาขึ้น (สีเขียวอ่อนโดยค่าเริ่มต้น)
- สีขาลง: สีสำหรับบล็อกขาลง (สีแดงโดยค่าเริ่มต้น)
- ปรับความโปร่งใสด้วยตัวเลือกสี
การตีความ
🟢 บล็อกสีเขียว (ขาขึ้น): โซนอุปสงค์ที่เป็นไปได้ 🔴 บล็อกสีแดง (ขาลง): โซนแรงต้านที่เป็นไปได้
หมายเหตุ: นี่คือตัวชี้วัดวิเคราะห์ทางเทคนิค ใช้ร่วมกับการจัดการความเสี่ยงอย่างเหมาะสม
สรุป
สรุปโดย AI
ICT Order Block is a technical analysis indicator designed for use on cTrader charts. It automatically identifies institutional order blocks, highlighting key price zones where market reactions may occur. The indicator detects bullish order blocks (potential institutional buying zones) and bearish order blocks (potential institutional selling zones), displaying them as colored rectangles—green for bullish support areas and red for bearish resistance areas. These blocks visually represent important supply and demand zones that traders can monitor.
Key features include automatic block detection, configurable display options such as the number of blocks shown (1–15), and a volatility filter to refine block selection. Users can choose how blocks disappear: either when a candle closes beyond the block or when the block is touched by price wicks. Color customization and transparency adjustments are also available for better chart integration.
Installation involves adding the indicator to a cTrader chart, after which the blocks appear automatically. This tool supports analysis across Forex, Indices, and Cryptocurrency markets. It serves as a visual aid for identifying potential support and resistance zones based on institutional trading activity and should be used alongside proper risk management practices.
โปรไฟล์อินดิเคเตอร์
รีวิวจากลูกค้า
3.5
รีวิว: 2
5 | 50 % | |
4 | 0 % | |
3 | 0 % | |
2 | 50 % | |
1 | 0 % |
รีวิวจากลูกค้า
January 27, 2026
the zones are blocking the candles, zones need to be behind the candles .other than that it is good
การสนทนา
คำถามที่พบบ่อย
Forex
Indices
Crypto
ผลิตภัณฑ์ที่มีให้บริการผ่าน cTrader Store รวมถึงบอทการเทรด อินดิเคเตอร์ และปลั๊กอิน มีให้บริการโดยนักพัฒนาบุคคลที่สามและมีไว้เพื่อวัตถุประสงค์ในการเข้าถึงข้อมูลและทางเทคนิคเท่านั้น cTrader Store ไม่ใช่โบรกเกอร์และไม่ได้ให้คำแนะนำการลงทุน คำแนะนำส่วนบุคคล หรือการรับประกันผลการดำเนินงานในอนาคต


ราคา
ตั้งแต่ 24/02/2025
15
การขาย
1.82K
ติดตั้งฟรี