
الوصف
نظام SMARTRSI CLOUD - أداة تحليل الزخم المتقدمة
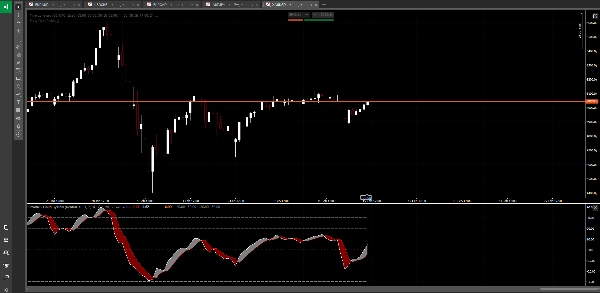
حوّل تحليلك لمؤشر RSI مع هذا المؤشر الثوري الذي يجمع بين تقنية تنعيم Heikin Ashi وRSI المركز على الصفر لإشارات زخم واضحة للغاية. على عكس مؤشرات RSI التقليدية التي قد تكون صاخبة وصعبة التفسير، يقوم نظام SmartRSI Cloud بتصفية ضوضاء السوق ويسلط الضوء على الزخم الاتجاهي الحقيقي.
الميزات الرئيسية:
☁️ سحابة Heikin Ashi RSI
اختبر تحليل الزخم المملّس مع تشكيلات سحابية بصرية. تعرض السحابة على الفور قوة واتجاه زخم السوق، مما يجعل تحديد الاتجاه سهلاً.
⚖️ RSI المركز على الصفر
شاهد الزخم كما هو بالضبط - مركز على الصفر لتحيز صعودي/هبوطي واضح. تشير القيم الإيجابية إلى قوة المشترين، والقيم السلبية تظهر ضغط البائعين. لا مزيد من التخمين إذا كان RSI يتجه صعودًا أو هبوطًا.
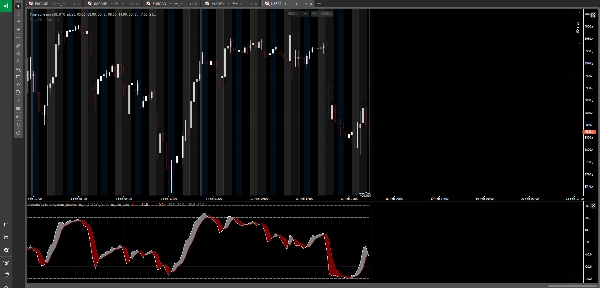
🎯 تقنية التنعيم الذكية
تخلص من الإشارات الخاطئة مع تنعيم RSI الذكي. يطبق المؤشر مبادئ Heikin Ashi على حسابات RSI، مما يقلل بشكل كبير من التقلبات المفاجئة مع الحفاظ على دقة الإشارة.
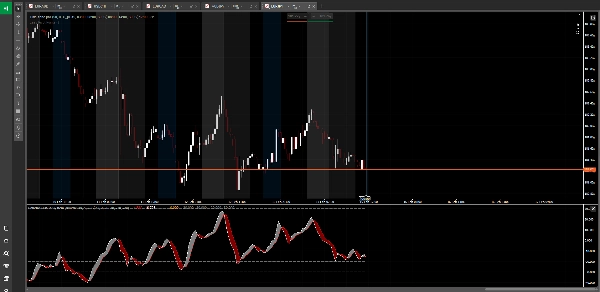
🔄 أوضاع المتداول التكيفية
التبديل بين ثلاثة أوضاع تداول:
• الوضع المحايد - عرض جميع الإشارات
• وضع المشترين - تصفية فرص الشراء فقط
• وضع البائعين - تصفية فرص البيع فقط
📊 مناطق التشبع الشرائي/البيعي متعددة المستويات
أربعة مستويات مميزة تساعدك على قياس أقصى الزخم:
• مستويات OB/OS القياسية للتحذيرات الأولية
• مستويات OB/OS القصوى لمناطق الانعكاس
• قابلة للتخصيص بالكامل لتتناسب مع أسلوب تداولك
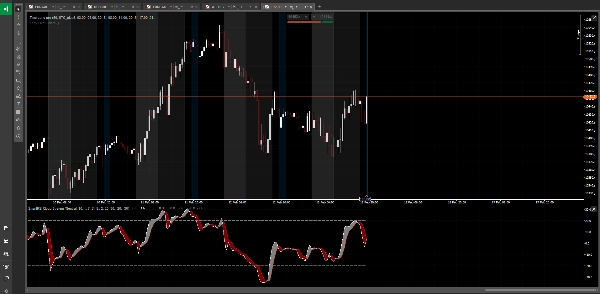
🎨 التصور الاحترافي
عرض نظيف وبديهي مع:
• تشكيلات سحابية ملونة
• خط رسم RSI اختياري مع ألوان قابلة للتخصيص
• مستويات حدود واضحة
• مرجع خط الصفر للتعرف الفوري على التحيز
⚙️ قابل للتخصيص بالكامل
اضبط كل جانب:
• طول HARSI ومعايير التنعيم
• فترة حساب RSI
• مستويات التشبع الشرائي/البيعي
• العناصر البصرية والألوان
• تفضيلات وضع المتداول
مثالي لـ:
• تحديد اتجاهات الزخم القوية
• اكتشاف التباينات بين السعر والزخم
• توقيت الدخول في حالات التشبع الشرائي/البيعي
• تصفية الصفقات بناءً على تحيز السوق
• تأكيد الاختراقات واستمرارية الاتجاه
• تحليل الزخم عبر أطر زمنية متعددة
ما الذي يجعله مختلفًا:
تعرض مؤشرات RSI التقليدية بيانات الزخم الخام التي قد تكون متقلبة ومضللة. يطبق نظام SmartRSI Cloud تنعيمًا بمستوى مؤسسي مع الحفاظ على سلامة الإشارة. يقضي النهج المركز على الصفر على الارتباك بشأن اتجاه الزخم، وتجعل تصور السحابة أنماط الزخم المعقدة قابلة للتعرف عليها على الفور.
سواء كنت تقوم بالتداول السريع، التداول اليومي، أو التداول المتأرجح، تمنحك هذه الأداة وضوحًا حول زخم السوق لا يمكن للمؤشرات القياسية تقديمه ببساطة.
---
⚠️ إخلاء مسؤولية المخاطر:
يحمل تداول العملات الأجنبية، العملات المشفرة، والأدوات المالية الأخرى مستوى عاليًا من المخاطر وقد لا يكون مناسبًا لجميع المستثمرين. يمكن أن يعمل الرفع المالي العالي ضدك وكذلك لصالحك. قبل اتخاذ قرار التداول، يجب أن تنظر بعناية في أهداف استثمارك، مستوى خبرتك، وشهيتك للمخاطر. هناك احتمال أن تتكبد خسارة لبعض أو كل استثمارك. لذلك، يجب ألا تستثمر أموالًا لا يمكنك تحمل خسارتها. يجب أن تكون على دراية بجميع المخاطر المرتبطة بالتداول وطلب نصيحة من مستشار مالي مستقل إذا كان لديك أي شكوك. الأداء السابق لا يدل على النتائج المستقبلية.
الملخص
تقييمات العملاء
5 | 100 % | |
4 | 0 % | |
3 | 0 % | |
2 | 0 % | |
1 | 0 % |


![شعار "[Stellar Strategies] Market Session Ultimate"](https://cdn.ctrader.com/image/webp/61ffd537-0125-4246-9e72-42eca1791d64_28232)


