
Penerangan
EMAScalpHistogram: Visualisasi Momentum untuk Pengurusan Perdagangan
Apakah EMAScalpHistogram?
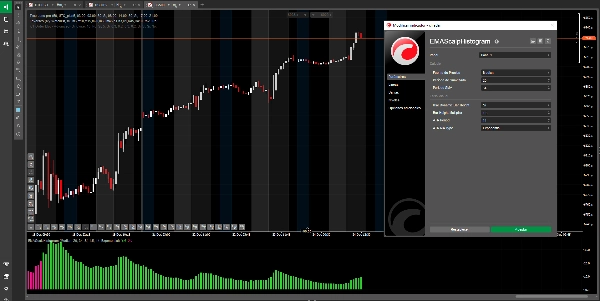
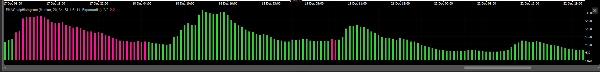
EMAScalpHistogram adalah alat analisis teknikal canggih yang mengubah kerumitan momentum pasaran menjadi histogram yang intuitif dan menarik secara visual. Reka bentuknya membolehkan pengenalpastian kekuatan dan arah tren dengan sekali pandang.
- Bar Hijau (Bullish): Menunjukkan momentum pembelian yang kuat, mencadangkan bahawa pembeli mengawal pasaran.
- Bar Merah Jambu (Bearish): Menunjukkan momentum penjualan yang kuat, mencadangkan bahawa penjual menguasai tindakan harga.
- Ketinggian Dinamik: Ketinggian bar tidak tetap; ia menyesuaikan dengan volatiliti pasaran. Bar yang lebih tinggi menandakan pergerakan dengan kekuatan dan keyakinan yang lebih, manakala bar yang lebih pendek menunjukkan jeda atau tren yang melemah.
Penggunaan Utama dan Strategi yang Disyorkan
EMAScalpHistogram adalah alat pengurusan perdagangan elit, direka untuk pedagang yang ingin memaksimumkan keuntungan dengan memegang posisi dengan keyakinan lebih tinggi. Nilai terbesarnya adalah membantu anda mengekalkan dan memperkuat keuntungan anda setelah anda sudah berada dalam perdagangan.
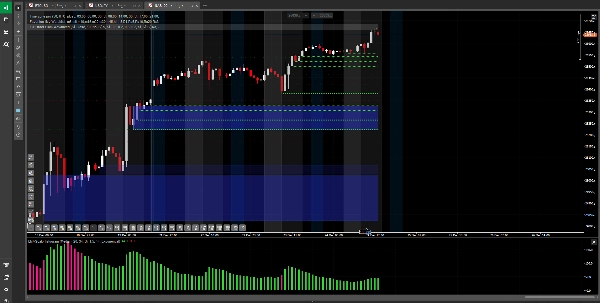
- Pengesahan Tren: Fungsi paling kuatnya adalah untuk mengesahkan kekuatan tren yang telah anda kenal pasti. Jika anda berada dalam posisi panjang dan histogram secara konsisten menunjukkan bar hijau, ia adalah pengesahan visual bahawa momentum pembelian masih utuh.
- Pengurusan Perdagangan (Memegang dan Memperkuat Keuntungan):
-
- Untuk Memegang Posisi: Ini adalah aplikasi paling berharga. Gunakannya untuk memutuskan bilakah untuk memegang posisi dengan keyakinan. Jika histogram terus menunjukkan bar yang menguntungkan anda, ia memberi anda disiplin untuk tidak menutup perdagangan yang menguntungkan terlalu awal kerana turun naik pasaran kecil.
- Untuk Memperkuat Keuntungan: Dengan membantu anda memegang posisi sepanjang fasa momentum kuat sepenuhnya, ia membolehkan anda menangkap pergerakan yang lebih besar dan memperkuat potensi keuntungan anda.
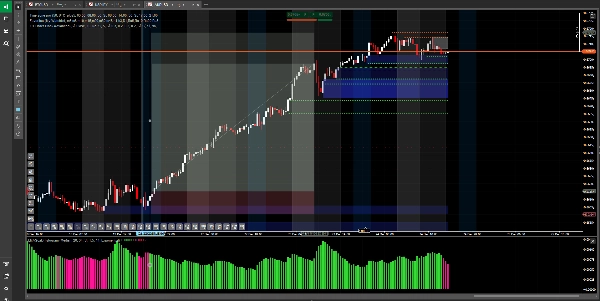
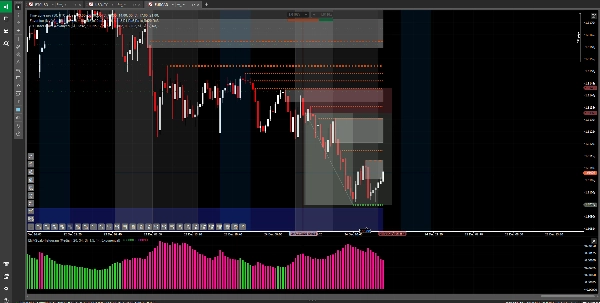
- Amaran untuk Momentum yang Melemah: Perubahan warna histogram (dari hijau ke merah jambu atau sebaliknya) adalah salah satu amaran pertama bahawa momentum sedang kehabisan tenaga, mencadangkan mungkin masa yang baik untuk mengamankan keuntungan atau menyesuaikan strategi keluar anda.
Apa yang Perlu Dielakkan
Bukan Isyarat Masuk: Secara kritikal, EMAScalpHistogram tidak direka untuk digunakan sebagai isyarat berdiri sendiri untuk membuka perdagangan baru. Sebagai indikator yang mengesahkan kekuatan pergerakan yang sudah berlangsung, menggunakannya untuk masuk boleh mengakibatkan perdagangan lewat dengan risiko tinggi dan potensi keuntungan yang terhad.
Amaran Risiko dan Penafian
Penggunaan indikator ini adalah atas risiko dan tanggungjawab anda sendiri. Perdagangan instrumen kewangan membawa tahap risiko yang tinggi dan mungkin tidak sesuai untuk semua pelabur. Alat ini tidak merupakan cadangan pelaburan atau nasihat kewangan. Prestasi lalu bukan jaminan keputusan masa depan. Sangat disyorkan untuk menguji mana-mana strategi pada akaun demo sebelum mempertaruhkan modal sebenar.
Ringkasan
Ulasan pelanggan
5 | 67 % | |
4 | 33 % | |
3 | 0 % | |
2 | 0 % | |
1 | 0 % |


