
Penerangan
IM_AngleIndicator menukar cerun purata bergerak mudah menjadi ukuran sudut objektif dan boleh dibandingkan.
Kebanyakan penunjuk "sudut" mengira cerun daripada perubahan harga mentah, tetapi hasilnya bergantung pada skala mutlak instrumen dan pada jangka masa — jadi nilai darjah yang sama bermaksud perkara yang sangat berbeza pada silang mata wang, indeks, atau mata wang kripto. IM_AngleIndicator menyelesaikan ini dengan menormalkan perubahan SMA dengan ATR: cerun dinyatakan dalam "ATR setiap bar" dan kemudian ditukar kepada darjah. Dengan cara ini, cerun 45° sentiasa mewakili pergerakan 1 ATR setiap bar, tanpa mengira instrumen atau jangka masa yang dianalisis. Hasilnya adalah bacaan yang konsisten dan ambang yang boleh digunakan semula di seluruh portfolio.
Cara ia berfungsi
- Mengira SMA pada harga penutupan mengikut tempoh yang dipilih.
- Mengukur perubahannya antara dua bar berturut-turut dan menormalkannya dengan membahagikan dengan ATR.
- Menukar nisbah yang terhasil kepada darjah melalui arctangen, mengembalikan nilai kira-kira antara −90° dan +90°.
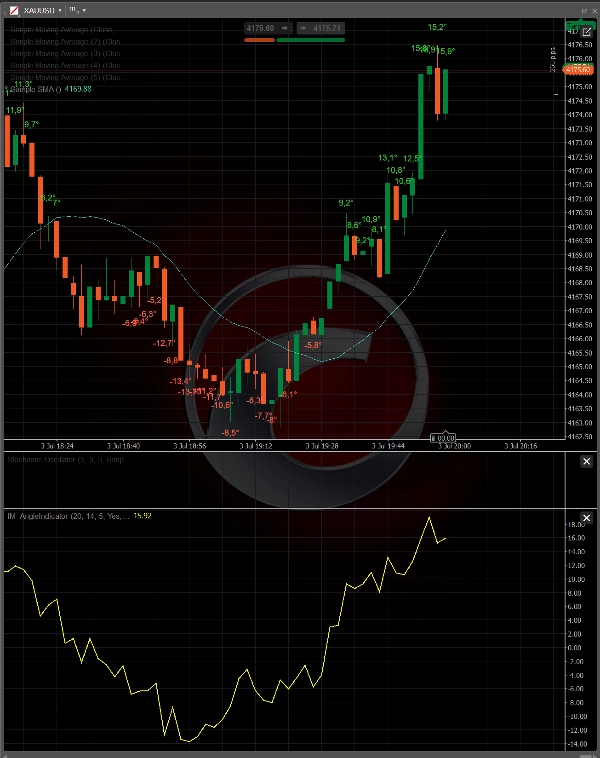
- Melakar nilai sebagai osilator dalam panel khusus dan, apabila cerun melebihi ambang yang ditetapkan, menambah label pada carta harga yang diletakkan di atas paras tinggi (trend menaik) atau di bawah paras rendah (trend menurun).
Ciri utama
- Pengukuran cerun bebas daripada instrumen dan jangka masa terima kasih kepada penormalan ATR.
- Ambang boleh laras dalam darjah untuk menapis pergerakan penting dan mengecualikan bunyi.
- Label berwarna arah (hijau untuk menaik, merah untuk menurun) dengan offset menegak berasaskan ATR untuk penempatan yang kemas berbanding lilin.
- Pengendalian objek carta yang dioptimumkan: label dihadkan kepada bar paling terkini untuk mengekalkan prestasi walaupun pada carta dengan sejarah panjang.
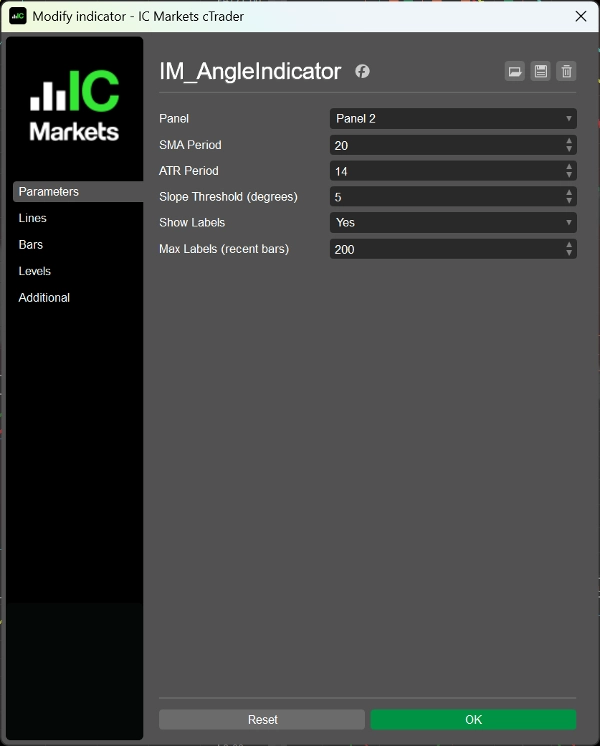
- Parameter boleh disesuaikan sepenuhnya: tempoh SMA, tempoh ATR, ambang cerun, keterlihatan label, dan bilangan maksimum label.
Kes penggunaan
- Mengenal pasti fasa trend kuat berbanding julat mendatar.
- Pengesahan arah untuk menyokong strategi masuk dan keluar.
- Membandingkan kekuatan trend merentasi pelbagai instrumen menggunakan ambang yang sama.
- Asas untuk membangunkan cBots yang menggunakan cerun dinormalisasi sebagai isyarat dagangan.
Ringkasan
Ulasan pelanggan
5 | 50 % | |
4 | 50 % | |
3 | 0 % | |
2 | 0 % | |
1 | 0 % |


![Logo "[Stellar Strategies] Inside Bar with Signals"](https://cdn.ctrader.com/image/webp/1d9e8bfa-3b2c-4440-bb37-5856902008a7_30683)


![Logo "Smart Money Concepts (SMC) [Iridio Capital]"](https://cdn.ctrader.com/image/webp/28b69fd1-ef54-4bed-9487-07e78e883be4_40934)


