

KasePeakOscillator
อินดิเคเตอร์
91 ดาวน์โหลด
เวอร์ชัน 1.0, May 2026
Windows, Mac
5.0
รีวิว: 4
ตั้งแต่ 21/02/2025
466.3M
ปริมาณการเทรด
180.83K
Pips ที่ได้กำไร
26
การขาย
7.43K
ติดตั้งฟรี
คำอธิบาย
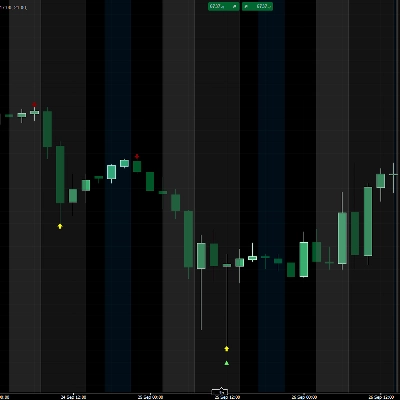
KasePeakOscillator (KPO) เป็นเครื่องมือวิเคราะห์ทางเทคนิคขั้นสูงที่ออกแบบมาเพื่อระบุการหมดแรงของตลาด การกลับตัวของแนวโน้ม และการเปลี่ยนแปลงของโมเมนตัม แตกต่างจากออสซิลเลเตอร์มาตรฐาน KPO ผสานรวมมาตรวัดความผันผวนทางสถิติเพื่อให้สัญญาณที่น่าเชื่อถือมากขึ้นในสภาวะตลาดที่หลากหลาย
วิธีการทำงาน: ตัวบ่งชี้คำนวณความสัมพันธ์ระหว่างการเคลื่อนไหวของราคาและความผันผวนในอดีต (ช่วงเฉลี่ยรายวัน/ส่วนเบี่ยงเบนมาตรฐาน) มันประเมิน "รอบสั้น" กับ "รอบยาว" เพื่อกำหนดว่าการเคลื่อนไหวของราคานั้นมีนัยสำคัญทางสถิติหรือเป็นเพียงเสียงรบกวนของตลาด ผลลัพธ์คือออสซิลเลเตอร์ที่เรียบลื่นและตอบสนองที่แกว่งไกวรอบเส้นศูนย์
ส่วนประกอบหลัก:
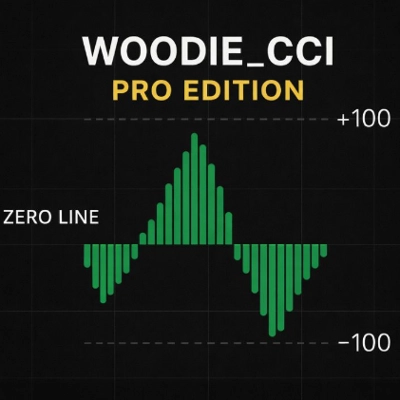
- ฮิสโตแกรม (KCD): แสดงโมเมนตัมหลัก การตัดผ่านเส้นศูนย์บ่งชี้การเปลี่ยนแปลงในแนวโน้มระยะสั้น
- แถบไดนามิก (บน/กลาง): ทำหน้าที่เป็นเกณฑ์ "ซื้อมากเกินไป" และ "ขายมากเกินไป" ทางสถิติ ปรับตัวตามความผันผวนของตลาด ขยายในช่วงกิจกรรมสูงและหดตัวในช่วงการรวมตัว
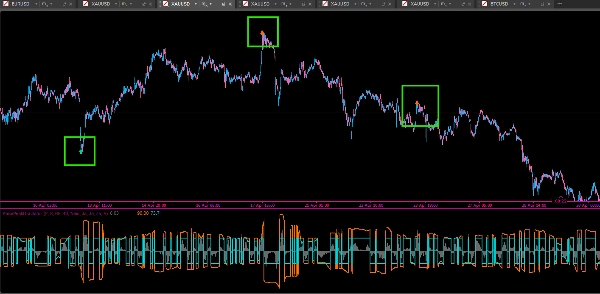
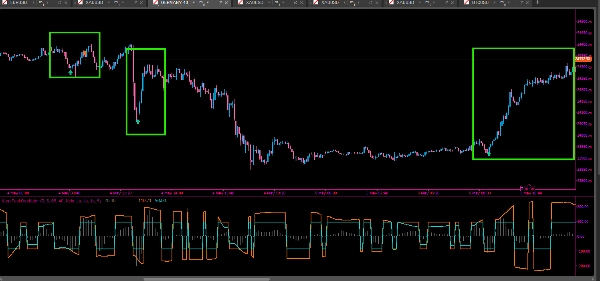
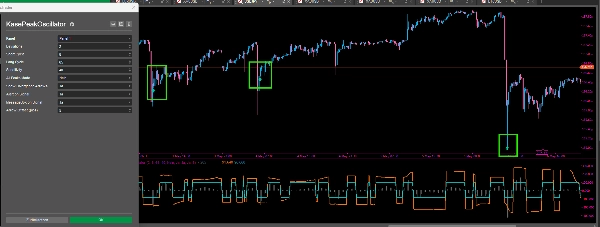
- การตรวจจับจุดสูงสุดอัตโนมัติ: ตัวบ่งชี้ระบุ "จุดสูงสุด" และ "จุดต่ำสุด" ที่โมเมนตัมถึงขีดสุดทางสถิติ บ่งชี้การหมดแรงที่เป็นไปได้
กลยุทธ์การซื้อขาย:
- การหมดแรงที่จุดสูงสุด: เมื่อจุดสูงสุดของโมเมนตัมเกิดขึ้นนอกแถบไดนามิก (แสดงด้วยลูกศรสีมิ้นต์หรือส้ม) แสดงว่าแนวโน้มปัจจุบันยืดเยื้อเกินไปและมีแนวโน้มที่จะกลับตัวหรือแก้ไข
- สัญญาณความแตกต่าง: KPO ระบุความแตกต่างแบบกระทิงและแบบหมีโดยอัตโนมัติ ความแตกต่างเกิดขึ้นเมื่อราคาทำจุดสุดขีดใหม่แต่ตัวออสซิลเลเตอร์ไม่ทำตาม บ่งชี้โมเมนตัมอ่อนแอ สัญลักษณ์เหล่านี้ถูกทำเครื่องหมายด้วย สีฟ้าอ่อน (กระทิง) และ สีทอง (หมี)
- การยืนยันแนวโน้ม: ใช้ตำแหน่งของฮิสโตแกรมเทียบกับเส้นศูนย์เพื่อยืนยันทิศทางแนวโน้ม การอยู่เหนือศูนย์สนับสนุนตำแหน่งยาว ในขณะที่การอยู่ต่ำกว่าศูนย์สนับสนุนตำแหน่งสั้น
คุณสมบัติ:
- ระบบแจ้งเตือนแบบบูรณาการ (เสียง, กล่องข้อความ, และไอคอนภาพ)
- ความไวที่ปรับได้เพื่อให้เหมาะกับประเภทสินทรัพย์ต่างๆ (ฟอเร็กซ์, ดัชนี, คริปโต)
- "โหมดจุดสูงสุดทั้งหมด" สำหรับการสแคปปิ้งแบบรุกหรือโหมดกรองสำหรับการตั้งค่าสวิงที่มีความน่าจะเป็นสูง
สรุป
AI summary
The KasePeakOscillator (KPO) is a technical indicator designed to detect market exhaustion, trend reversals, and momentum shifts by integrating price action with statistical volatility measures. It calculates the relationship between short-term and long-term price cycles adjusted for historical volatility, producing a smooth oscillator around a zero line.
Key components include:
- Histogram (KCD): Represents core momentum; zero-line crossings indicate short-term trend changes.
- Dynamic Bands: Volatility-adjusted thresholds signaling overbought or oversold conditions.
- Automated Peak Detection: Identifies momentum extremes signaling potential trend exhaustion.
The KPO provides automated alerts for peak exhaustion and divergence signals, marking bullish and bearish divergences when price and momentum disagree. Trend direction can be confirmed by the histogram’s position relative to zero.
Features include adjustable sensitivity for various asset classes such as Forex, indices, and cryptocurrencies, an integrated alert system (sound, message, visual icons), and modes tailored for scalping or swing trading. The indicator supports analysis based on price bars and outputs reversal and divergence signals to assist in trading decisions.
Key components include:
- Histogram (KCD): Represents core momentum; zero-line crossings indicate short-term trend changes.
- Dynamic Bands: Volatility-adjusted thresholds signaling overbought or oversold conditions.
- Automated Peak Detection: Identifies momentum extremes signaling potential trend exhaustion.
The KPO provides automated alerts for peak exhaustion and divergence signals, marking bullish and bearish divergences when price and momentum disagree. Trend direction can be confirmed by the histogram’s position relative to zero.
Features include adjustable sensitivity for various asset classes such as Forex, indices, and cryptocurrencies, an integrated alert system (sound, message, visual icons), and modes tailored for scalping or swing trading. The indicator supports analysis based on price bars and outputs reversal and divergence signals to assist in trading decisions.
โปรไฟล์อินดิเคเตอร์
หมวดหมู่อินดิเคเตอร์
Momentum
ประเภทเอาต์พุต
สัญญาณ
ข้อกำหนดด้านข้อมูล
แท่งเท่านั้น
สัญญาณที่รองรับ
Reversal
Divergence
รีวิวจากลูกค้า
5.0
รีวิว: 4
5 | 100 % | |
4 | 0 % | |
3 | 0 % | |
2 | 0 % | |
1 | 0 % |
รีวิวจากลูกค้า
September 10, 2026
KasePeakOscillator is a well-presented momentum and exhaustion oscillator with a clear KCD histogram, adaptive-looking bands, configurable short/long cycles and visual peak signals. Testing on EURUSD and XAUUSD across M1, H1 and D1 showed stable rendering and distinct timeframe behavior, with a historical bearish peak marker clearly visible on XAUUSD H1.
August 7, 2026
Your indicator is great but the audio alert is not active. How can I enable it?

July 28, 2026
May 27, 2026
Reliable tool with a learning curve This indicator takes a little time to get used to, but once you understand how to read the signals properly it delivers solid results. Works best when combined with support and resistance levels and a clear market structure.
การสนทนา
คำถามที่พบบ่อย
Key Levels
Volume
ผลิตภัณฑ์ที่มีให้บริการผ่าน cTrader Store รวมถึงบอทการเทรด อินดิเคเตอร์ และปลั๊กอิน มีให้บริการโดยนักพัฒนาบุคคลที่สามและมีไว้เพื่อวัตถุประสงค์ในการเข้าถึงข้อมูลและทางเทคนิคเท่านั้น cTrader Store ไม่ใช่โบรกเกอร์และไม่ได้ให้คำแนะนำการลงทุน คำแนะนำส่วนบุคคล หรือการรับประกันผลการดำเนินงานในอนาคต



























ราคา
ตั้งแต่ 21/02/2025
466.3M
ปริมาณการเทรด
180.83K
Pips ที่ได้กำไร
26
การขาย
7.43K
ติดตั้งฟรี