
Description
Auto Tools Suite —
Slogan : Auto Trendlines, Fibonacci, Pitchfork et Patterns à partir de pivots non re-peints. Maintenant avec préréglages en 1 clic et alertes intelligentes.
Quoi de neuf (cette version)
- ✅ Préréglages : PriceActionClean, FibOnly, StructureScanner (ou Custom).
- ✅ Alertes : Rupture de ligne de tendance, Contact Fib, et Pattern (Double Top/Bottom) avec déduplication.
- ✅ Paramètres groupés : Moteur de pivot, Lignes de tendance, Fibonacci, Pitchfork, Patterns, Alertes, Performance pour un panneau épuré.
Les pivots confirmés ne se re-peignent pas (seule la dernière jambe est en direct jusqu'à confirmation). API moderne
Bars.*&Chart.*.
Aperçu
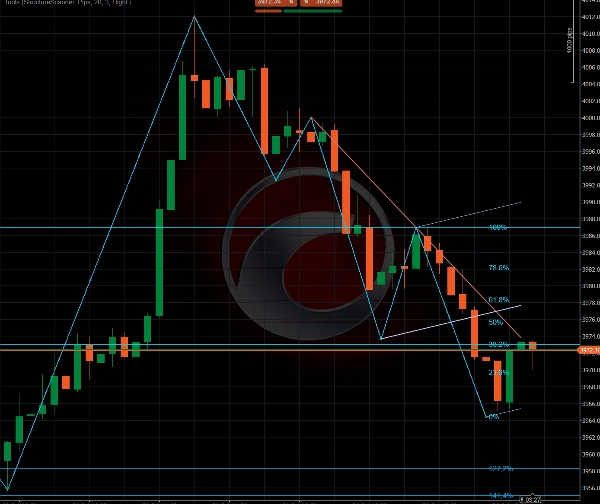
Auto Tools Suite construit la structure du marché en temps réel à partir de pivots de type ZigZag (seuil en pips ou pourcentage) :
- Auto Trendlines — support/résistance dynamique à partir des hauts/bas confirmés.
- Auto Fibonacci — retracements & extensions du dernier impulsion.
- Auto Pitchfork (Andrews) — médiane + rails optionnels des 3 derniers pivots.
- Patterns — Double Top / Double Bottom avec tolérance & espacement minimum.
- Préréglages — mises en page des modules en un clic. Alertes — étiquettes/journaux déclenchés par événement avec tolérance en pips.
Groupes de paramètres (résumé)
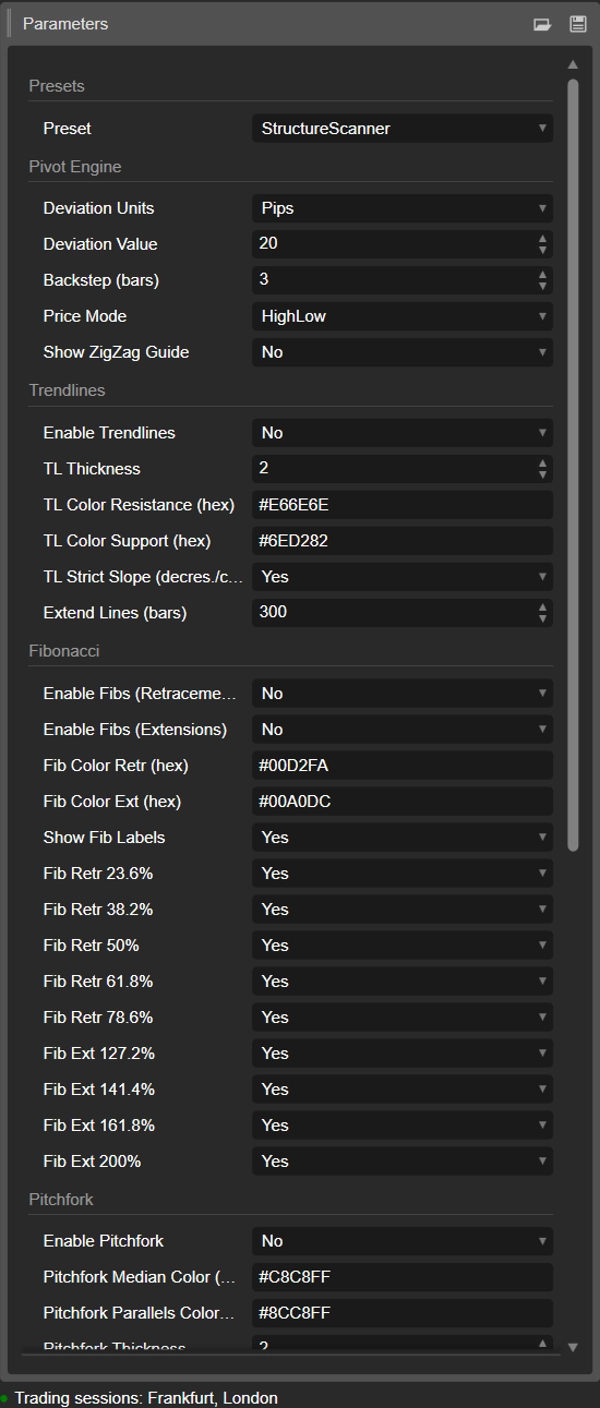
Moteur de pivot
- Unités/Valeur de déviation — seuil de retournement en pips ou %.
- Backstep — nombre minimum de barres entre pivots.
- Mode Prix — Haut/Bas (plus sensible) ou Clôture (plus conservateur).
- Afficher le guide ZigZag — afficher la dernière jambe en direct avant confirmation.
Lignes de tendance
- Activer, Épaisseur LT, Couleurs (hex pour rés./sup.).
- Pente stricte LT — nécessite des hauts plus bas pour la résistance / des bas plus hauts pour le support.
- Étendre les lignes (barres) — projeter les lignes vers la droite.
Fibonacci
- Activer Retr/Ext, Couleurs retr/ext, Afficher les étiquettes Fib.
- Niveaux sélectionnables — 23.6/38.2/50/61.8/78.6 et 127.2/141.4/161.8/200.
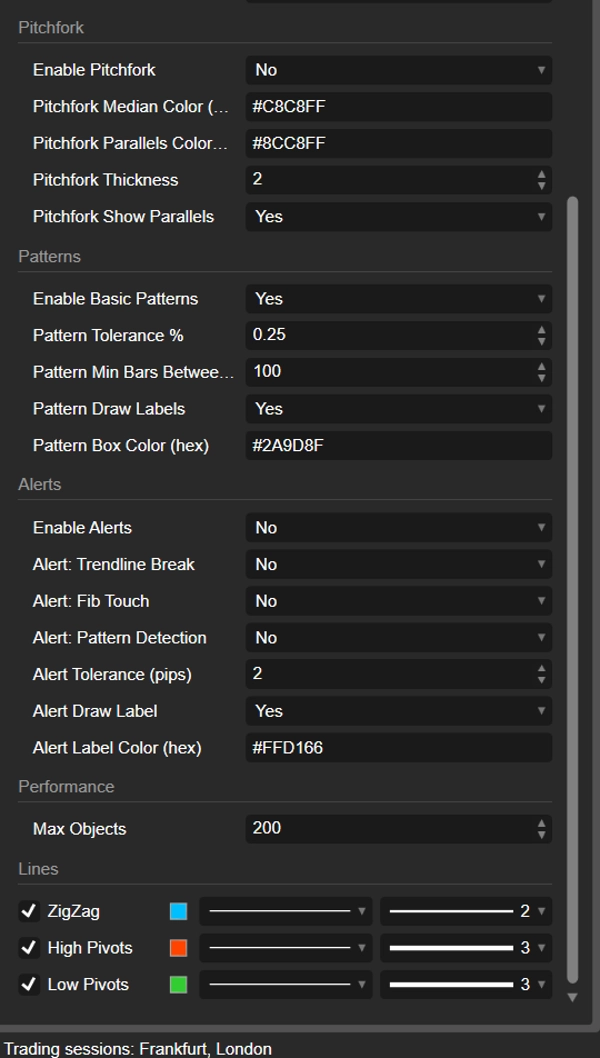
Pitchfork
- Activer, Couleurs médiane/parallèles, Épaisseur, Afficher les parallèles.
Patterns
- Activer, Tolérance du pattern %, Min barres entre pics, Dessiner les étiquettes, Couleur de la boîte.
Alertes
- Activer les alertes (maître), Rupture de ligne de tendance, Contact Fib, Détection de pattern.
- Tolérance d'alerte (pips), Dessiner l'étiquette d'alerte, Couleur de l'étiquette d'alerte.
Performance
- Objets max — limite FIFO sur les objets du graphique pour garder les graphiques réactifs.
Préréglages (1 clic)
- PriceActionClean — Lignes de tendance activées, retracement Fib activé, extension désactivée, Pitchfork désactivé, Patterns désactivés, étiquettes Fib désactivées.
- FibOnly — uniquement Fibonacci (retr + ext) avec étiquettes activées.
- StructureScanner — tout activé, y compris les rails Pitchfork & les étiquettes Fib.
- Custom — utilisez exactement vos valeurs de paramètres.
Les préréglages affectent les bascules/étiquettes des modules à l'exécution ; les entrées numériques (Déviation, Backstep, etc.) restent telles que vous les avez définies.
Démarrage rapide
- Réglez les pivots : définissez Déviation (pips ou %) et Backstep (3–7).
- Choisissez un Préréglage (par ex., StructureScanner) pour activer instantanément les modules.
- Activez les Alertes, choisissez les événements, et définissez la Tolérance d'alerte (par ex., 1–3 pips sur FX ; plus élevé sur indices).
- Réduisez le bruit visuel : désactivez les niveaux Fib rarement utilisés et gardez la Limite d'objets raisonnable.
Conseils pratiques
- Intraday bruyant : Pourcentage 0.6–1.2, Backstep 5–8, Pente stricte LT activée, moins de niveaux Fib.
- Swing : Pourcentage 1.0–2.0, Pitchfork activé, Ext 127/161/200, Patterns activés.
- Vérification de breakout : confirmez avec ligne de tendance + cluster Fib ; utilisez l'alerte Rupture de ligne de tendance.
Compatibilité & performance
- Fonctionne sur tout symbole et intervalle de temps.
- Les objets du graphique sont gérés avec FIFO ; ajustez la Limite d'objets selon votre mise en page.
FAQ (rapide)
Q : Rien ne s'affiche.
R : Baissez la Déviation ou augmentez le Backstep. Vous avez besoin d'au moins 2 pivots pour Fib, 3 pour Pitchfork.
Q : Les alertes sont bruyantes.
R : Les alertes sont dédupliquées par barre/clé ; augmentez la Tolérance d'alerte (pips) pour réduire les faux contacts.
Q : Puis-je changer toutes les couleurs ?
R : Oui, chaque couleur est en HEX (par ex., #FF6B6B).
Journal des modifications (dernières)
- Ajout des Préréglages (PriceActionClean / FibOnly / StructureScanner / Custom).
- Ajout des Alertes (rupture de ligne de tendance, contact fib, pattern) avec tolérance en pips et étiquettes optionnelles.
- Réorganisation des paramètres en groupes logiques.
Résumé
Key features include:
- One-click presets (PriceActionClean, FibOnly, StructureScanner, Custom) for quick module configuration.
- Smart alerts for trendline breaks, Fibonacci touches, and pattern detections with pip tolerance and optional labels.
- Grouped parameters for pivot engine, trendlines, Fibonacci, pitchfork, patterns, alerts, and performance for streamlined settings.
- Pivot engine settings allow tuning of reversal thresholds in pips or percent, minimum bars between pivots, and price mode (High/Low or Close).
- Customizable visual elements such as line thickness, colors (HEX), and label display.
- Performance management via a maximum objects cap to maintain chart responsiveness.
- Compatible with any symbol and timeframe, suitable for indices and forex markets.
The indicator uses modern chart and bar APIs and manages chart objects in FIFO order. It supports practical use cases including noisy intraday, swing trading, and breakout confirmation with recommended parameter ranges and alert configurations.
Avis clients
5 | 67 % | |
4 | 0 % | |
3 | 33 % | |
2 | 0 % | |
1 | 0 % |


