
Cosmic Decision System Pro
Indicateur
1 achats
Version 1.0, Oct 2025
Windows, Mac
4.0
Avis : 1
Analyse HTF, Analyse MTF, Supporte toutes les paires
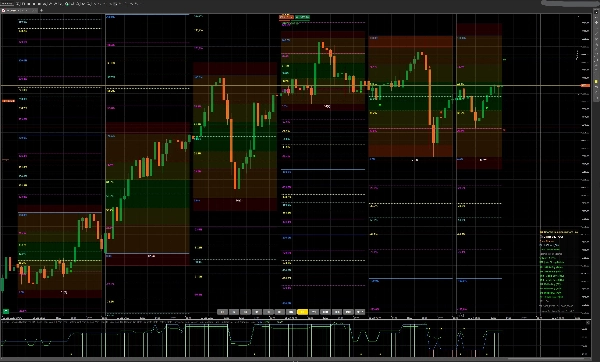
Niveaux d'expansion Fibo et signaux ACHAT / VENTE sur toutes les périodes
Séparateurs de temps automatiques avec Fibo
Veuillez utiliser avec un nouveau panneau
Profil de l'indicateur
4.0
Avis : 1
5 | 0 % | |
4 | 100 % | |
3 | 0 % | |
2 | 0 % | |
1 | 0 % |
Avis clients
November 6, 2025
Cosmic Decision System Pro looks ambitious - multi-TF signals and Fibo zones on one chart. In QA tests it ran smoothly with minor render lags but no crashes. If your Fibo lines vanish, reload the chart - bug’s there but harmless. Solid concept, needs a bit of polish to shine.
BTCUSD
Forex
Signal
Indices
EURUSD
Commodities
GBPUSD
NZDUSD
Fibonacci
Prop
Crypto
Stocks
XAUUSD
NAS100
USDJPY
Les produits disponibles sur cTrader Store, notamment les bots de trading, les indicateurs et les plug-ins, sont fournis par des développeurs tiers et mis à disposition à titre informatif et à des fins d'accès technique uniquement. cTrader Store n'est pas un courtier et ne fournit aucun conseil en investissement, aucune recommandation personnelle ni aucune garantie quant aux performances futures.


![Logo de "High-Low Divergence [Iridio Capital]"](https://cdn.ctrader.com/image/webp/443c4661-7abb-40f1-842f-4b6ec560649b_40914)


Depuis le 05/12/2024