
Dem
Indicateur
2 achats
Version 2.0, Apr 2026
Windows, Mac
4.2
Avis : 4

Description
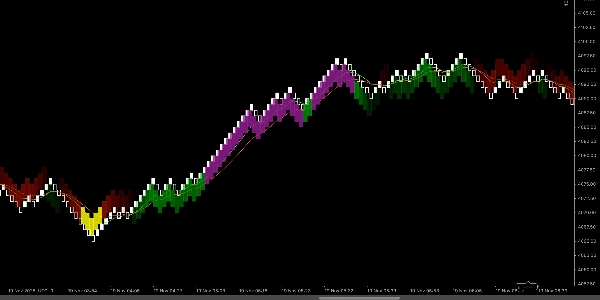
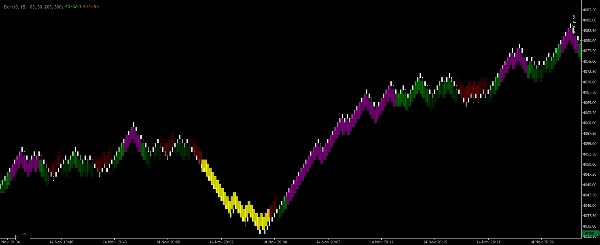
Zones Renko EMA-Scalper est un indicateur de scalping léger et visuel conçu exclusivement pour les graphiques Renko 100 pips sur la plateforme cTrader. Il utilise deux moyennes mobiles exponentielles (EMA) pour identifier la direction de la tendance à court terme et pour mettre en évidence des zones nettes et exploitables. L'indicateur dessine des rectangles remplis sur le graphique en quatre couleurs afin que les scalpers puissent immédiatement lire le biais du marché et repérer des entrées à plus forte probabilité sans calcul manuel.
Ce que chaque couleur signifie
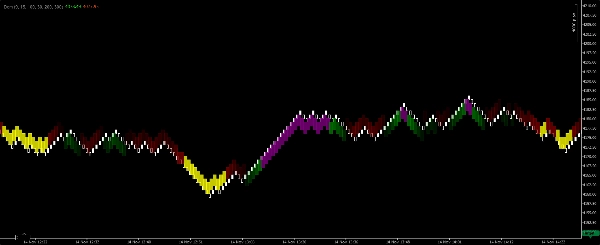
- Rectangle vert — Tendance haussière confirmée. L'EMA rapide est au-dessus de l'EMA lente et les EMA sont orientées vers le haut. À utiliser pour des positions longues courtes suivant la tendance.
- Rectangle violet — Zone d'entrée d'achat dans un contexte haussier. Indique un repli ou une consolidation à court terme dans une tendance haussière active qui peut offrir une opportunité de scalping.
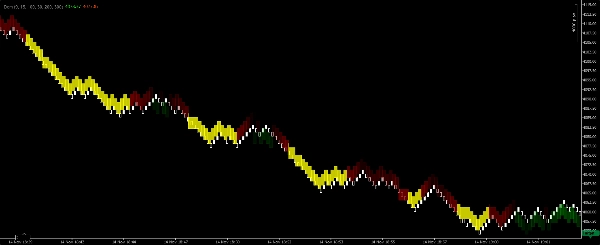
- Rectangle rouge — Tendance baissière confirmée. L'EMA rapide est en dessous de l'EMA lente et les EMA sont orientées vers le bas. À utiliser pour des positions courtes courtes suivant la tendance.
- Rectangle jaune — Zone d'entrée de vente dans un contexte baissier. Indique un repli ou une consolidation à court terme dans une tendance baissière active qui peut offrir une opportunité de scalping.
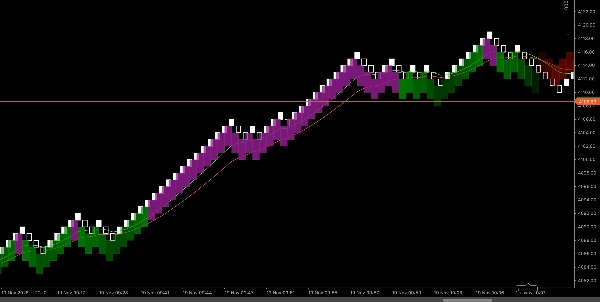
Comment cela fonctionne (résumé de la logique)
- L'indicateur calcule deux EMA (rapide et lente) sur un graphique Renko 100 pips et évalue leur alignement relatif et leur pente pour déterminer la direction de la tendance.
- Lorsque les EMA indiquent un alignement haussier clair et un momentum, l'indicateur trace un rectangle vert qui couvre la zone de tendance. Si une courte consolidation ou un repli apparaît dans cette zone haussière, l'indicateur trace un rectangle violet pour marquer une opportunité d'entrée d'achat.
- La même logique s'applique en sens inverse pour les conditions baissières, produisant des rectangles rouges (tendance) et jaunes (entrée).
- Les rectangles sont dessinés comme des zones (et non des barres uniques) afin que les scalpers puissent visuellement évaluer où synchroniser des entrées et sorties rapides.
Paramètres recommandés (valeurs par défaut pour scalping)
- Type de graphique : Renko
- Taille de brique Renko : 100 pips (indicateur conçu pour cette taille de brique).
- Sensibilité / détection — un paramètre ajustable contrôle la rigueur avec laquelle l'indicateur exige l'alignement des EMA avant de tracer les rectangles de tendance (plus bas = plus de signaux ; plus haut = moins de signaux, mais plus forts).
- Opacité des rectangles — ajustez pour une meilleure clarté visuelle sur les barres de prix.
- Filtre de session — recommandé de restreindre aux heures de forte liquidité pour le scalping.
- Largeur maximale de zone (barres) — limite optionnelle pour éviter des zones trop étendues.
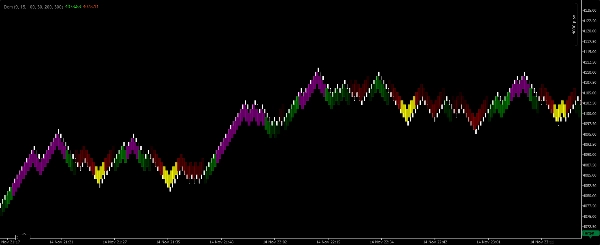
Conseils d'utilisation & règles de scalping
- Considérez les rectangles verts/rouges comme une confirmation de tendance. Privilégiez le trading dans la direction de la zone de tendance colorée et évitez les scalps agressifs contre-tendance lorsque la zone de tendance domine.
- Utilisez les rectangles violets/jaunes comme fenêtres d'entrée pour le scalping dans la tendance confirmée — cherchez un déclencheur de micro-structure rapide (par exemple, une barre de momentum, une cassure d'une petite consolidation) avant d'entrer.
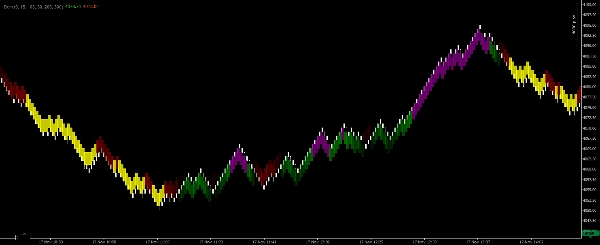
- Les objectifs doivent être serrés et réalistes pour le scalping (petits multiples de votre stop). Utilisez des objectifs fixes en pips ou des confirmations par nombre minimum de barres selon votre profil de risque.
- Placez les stops au-delà du plus bas/haut récent de la micro-structure ou en dehors de la zone d'entrée ; le scalping nécessite des pertes disciplinées et limitées.
- Combinez avec une confirmation volume/action des prix (si disponible) et tradez uniquement pendant les sessions actives.
- Faites des backtests visuels sur vos instruments — Renko 100 pips favorise les paires et instruments volatils où les briques de 100 pips produisent une structure de prix utile pour le scalping.
Résumé
Profil de l'indicateur
Avis clients
4.2
Avis : 4
5 | 50 % | |
4 | 25 % | |
3 | 25 % | |
2 | 0 % | |
1 | 0 % |
Avis clients
November 25, 2025
A decent setup here should survive 50 quick trades without looking messy. A few sessions of data make the result easier to trust. The useful comparison is hit rate versus average R.
November 18, 2025
The product feels more useful when the plan is already written down. A 13 setup run on daily close keeps the review grounded.
November 18, 2025
This feels useful when you already has a plan. The main value is short term execution, not chasing every signal that appears. Early sizing should stay modest until the journal looks stable.
November 18, 2025
Useful tool, but not for lazy entries. It supports short term execution and feels more useful if the trader stays selective.
Discussion
Questions fréquentes
BTCUSD
Forex
Signal
Scalping
Commodities
Crypto
XAUUSD
Les produits disponibles sur cTrader Store, notamment les bots de trading, les indicateurs et les plug-ins, sont fournis par des développeurs tiers et mis à disposition à titre informatif et à des fins d'accès technique uniquement. cTrader Store n'est pas un courtier et ne fournit aucun conseil en investissement, aucune recommandation personnelle ni aucune garantie quant aux performances futures.
Plus de cet auteur


Prix
Depuis le 14/03/2025
23
Ventes