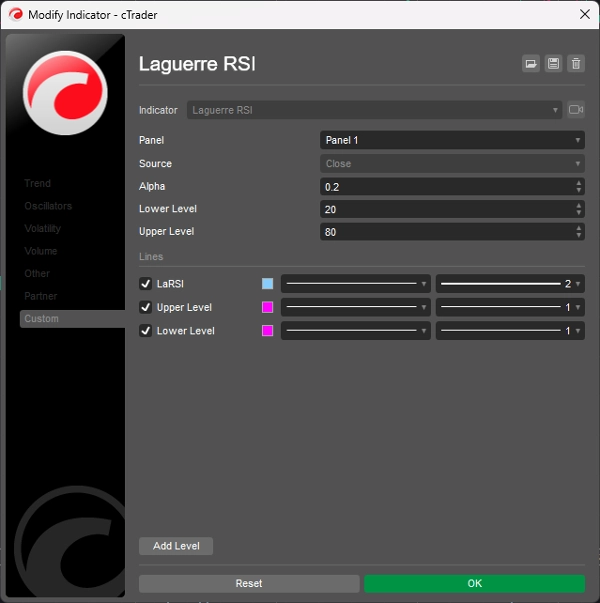
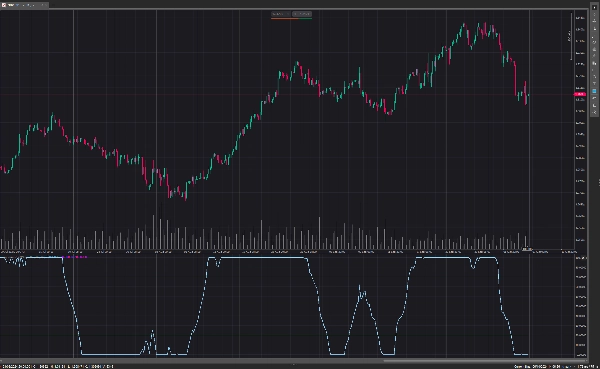
Brókeres y props
Para empresas
00
Days
:
00
Hours
:
00
Minutes
:
00
Seconds
Laguerre RSI
5.0
03/09/2025
567
Desktop
Desde 03/10/2024
Ventas
1
Instalaciones gratis
5918
Imagen cargada de "Laguerre RSI"Imagen cargada de "Laguerre RSI"

Laguerre RSI is based on John EHLERS' Laguerre Filter to avoid the noise of RSI.

Change the alpha coefficient to increase/decrease lag and smoothness.
the
Buy when Laguerre RSI crosses upwards above 20.
Sell when Laguerre RSI crosses down below 80.

While the indicator runs flat above 80, an uptrend is strong.
While the indicator runs flat below the 20 level, it means that a downtrend is strong.

5.0
Valoraciones: 1
5
100 %
4
0 %
3
0 %
2
0 %
1
0 %
Valoraciones de clientes
July 14, 2025
Pros: Smooths RSI using Laguerre filter, reducing noise and lag. Clear overbought/oversold levels. Great for scalping. Cons: No alerts or tooltips. Requires confirmation with trend filters. Lacks setting templates and advanced features.
Más de este autor
Mejor valorado
Gratis
Indicador
ATR
Supertrend
PMAX
It's a combination of two trailing stop loss and the other one is well-known ATR-based SuperTrend.
cBot
Grid
RSI
XAUUSD
+18
Investion X V1.9 - Intelligent Filter-Based Trading System
Trading system combining martingale strategy with multi-layered technical analysis and comprehensive protection features
Indicador
RSI
Indices
StochasticRSI
Stochastic RSI (StochRSI) is a technical indicator used to measure the strength and weakness of the RSI.
Indicador
Indices
AI
Machine Learning Momentum Index
The Machine Learning Momentum Index (MLMI) represents the next step in oscillator trading.
KDJ
The KDJ oscillator display consists of 3 lines (K, D and J - hence the name of the display) and 2 levels.
Indicador
Breakout
Forex
On Balance Volume
On Balance Volume (OBV) measures buying and selling pressure as a cumulative indicator.
Quantitative Qualitative Estimation
The QQE (Quantitative Qualitative Estimation) Weighted Oscillator improves its original version by weighting the RSI.
Indicador
Breakout
Stocks
Signal
Darvas Box
The Darvas Box involves identifying "boxes" or trading ranges where a stock's price consolidates before breaking out.
Indicador
Indices
Breakout
Stocks
+3
Ichimoku Cloud Indicator
The Ichimoku Cloud is a comprehensive technical analysis system developed by Japanese journalist Goichi Hosoda
Chaikin Money Flow
Chaikin money flow's primary purpose is to distinguish between periods of accumulation and distribution of a security.
cBot
Grid
Martingale
Investion Basic
This is a basic martingale bot without an indicator. For long and short trading options at the same bot.
Puede interesarle
Indicador
Indices
Stocks
Commodities
+2
PRC Momentum Hybrid
a visually very powerful tool for analyzing "opposing forces".
Indicador
Forex
EURUSD
AI
Future_AI_Indicator
Future-AI indicator.
Mejor valorado
Gratis
IR Candle MTF
with this indicator you could see other time frame candle in your chart.
VWAP
Track VWAP for Asia, London, NY, Sydney, Daily, Weekly, Monthly & Custom Sessions. Perfect for FX & intraday trading!
Pivot Points
Pivot Points Indicator
Support Resistance Zones
Support and Resistance.
VGM - Auto Fibo Retracement
Auto Fibonacci Retracement Indicator.
Zero Lag MACD
Zero Lag MACD delivers ultra-responsive trend and divergence signals with minimal lag, empowering timely Forex entries.
Indicador
NAS100
NZDUSD
Martingale
+26
Deep Mood Distribution_v1.1
Deep Mood Distribution (DMD) is a segmented volume-profile and sentiment tool that analyzes price action in fixed bar bl
Indicador
NAS100
NZDUSD
XAUUSD
+11
SwingHighLowDetector
Introducing High Accuracy multi timeframe Swing high and low detector.
Indicador
Indices
Prop
Stocks
+6
New Way Sar - Pro
The Parabolic SAR, or "Stop and Reverse," is a dynamic technical analysis tool
Indicatore livelli numeri tondi_fabio23.traders
Indicatore dei livelli numeri tondi sul grafico , regolabile.Indicator of levels round numbers on the graph, adjustable
Indicador
Breakout
XAUUSD
Forex
+2
McDonalds Pattern-Bzier Curve
Designed to identify and visualize price reversal patterns using Bézier curves.
Simple MACD Histogram
Simple MACD Histogram with color-coded rising (green) and falling (red) momentum bars.
Indicador
NAS100
NZDUSD
Martingale
+26
Intraday MTF Candle Status
Intraday MultiTimeframe Candle Status Indicator
Indicador
EURUSD
Compare Symbol
Plots chosen symbol's close price, candlestick (wick, body) on cTrader chart, supports multiple timeframes.
Time To Break Even Indicator v2
Time To Break Even Indicator. This indicator helps you time your trade's entry.
Mejor valorado
Gratis
Indicador
Indices
Stocks
Forex
+1
Daily Fibo
Daily Fibo